PUBLISHER: Mordor Intelligence | PRODUCT CODE: 2100660

PUBLISHER: Mordor Intelligence | PRODUCT CODE: 2100660
Sensor Fusion in Autonomous Vehicles - Market Share Analysis, Industry Trends & Statistics, Growth Forecasts (2026 - 2031)
According to Mordor Intelligence, the sensor fusion market size in autonomous vehicles is expected to grow from USD 4.42 billion in 2025 to USD 5.25 billion in 2026 and is forecast to reach USD 12.41 billion by 2031 at 18.76% CAGR over 2026-2031.
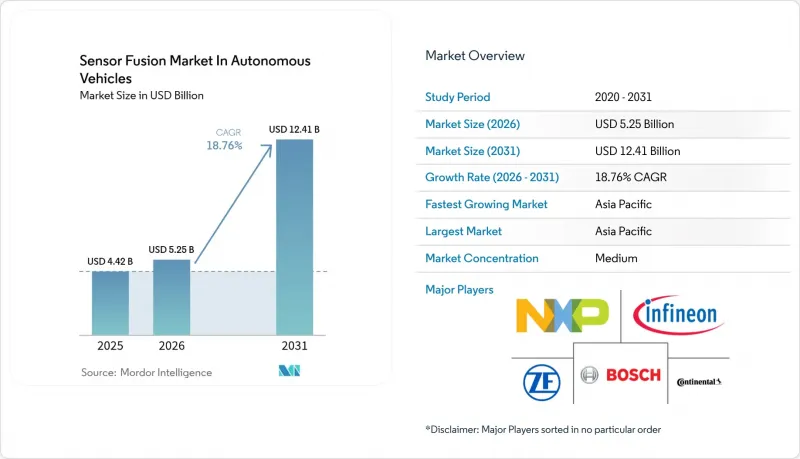
This report is Segmented by Sensor Type (LiDAR, and More), Component (Hardware, and More), Technology (MEMS Sensors and Non-MEMS Sensors), Level of Automation (Level 1, and More), Propulsion Type (Internal Combustion Engine Vehicles, and More), Vehicle Type (Passenger Cars, Light Commercial Vehicles, and More), and Geography. The Market Forecasts are Provided in Terms of Value (USD).
Insights and Trends of Sensor Fusion Market in Autonomous Vehicles
Mainstream ADAS Mandates Accelerating Multi-Sensor Adoption
Euro NCAP's 2025 rules make forward-collision mitigation and lane-keeping mandatory for a five-star rating, pushing every major automaker in Europe to adopt multi-sensor stacks. The U.S. FMVSS 127 final rule requires the implementation of pedestrian automatic emergency braking by 2029, combining camera classification with radar range-rate to reduce urban false positives. China's C-NCAP 2024 scoring upgrade rewards nighttime pedestrian detection, prompting BYD and Geely to integrate 905-nanometer LiDAR with millimeter-wave radar. Tighter timelines compress validation cycles, favoring suppliers that provide simulation libraries and annotated edge-case data. As mandates converge, the sensor fusion market in autonomous vehicles gains a self-reinforcing demand loop among mainstream brands.
Declining Solid-State LiDAR Costs Below USD 400 per Unit
Hesai's 2024 roadmap aims to achieve a sub-USD 200 bill-of-material cost by 2026 through ASIC integration and automated optical alignment. Innoviz secured a USD 350 supply deal for 500,000 units with a European premium OEM, signaling that LiDAR is fast approaching radar price parity. Removing mechanical mirrors reduces failure rates and meets AEC-Q100 Grade 2 thermal cycles, enabling deployment in Level 2+ cars that require improved cut-in detection. As cost curves bend, the sensor fusion market in autonomous vehicles shifts from radar-camera dominance toward LiDAR-inclusive perception, especially in premium sedans and crossovers where consumers pay a safety premium.
Absence of Global Sensor-Data Standards Across OEMs
ISO 23150 remains in draft, leaving vendors to custom-code radar, LiDAR, and camera middleware per customer. SAE J2735 omits fusion schemas, and AUTOSAR Adaptive 24-11 lacks binding cross-sensor timestamp specs. Tier-1 suppliers, therefore, maintain parallel code branches, which inflates engineering spend by 20-30% and delays launches. Smaller firms struggle to recoup validation costs, thinning competition in the sensor fusion market for autonomous vehicles. A breakthrough may arrive only when regulators codify a canonical interface, but consensus across the U.S., EU, and China looks two model cycles away.
Other drivers and restraints analyzed in the detailed report include:
- In-Vehicle Edge-AI Chipsets Enabling less than and equal to 10 ms Fusion Latency
- Over-the-Air Regulation Requiring Continuous Perception Updates
- Double-Digit Tariffs on LiDAR and IMU Imports in 2025
For complete list of drivers and restraints, kindly check the Table Of Contents.
Segment Analysis
Radar retained 35.72% of the sensor fusion market share in autonomous vehicles in 2025, thanks to its low cost and all-weather reliability. The sensor fusion market size in autonomous vehicles for LiDAR, however, is projected to rise at a 21.63% CAGR through 2031, as Euro-NCAP-compliant Level 3 offerings, such as Mercedes-Benz Drive Pilot, rely on centimeter-level depth. Greater object-classification confidence in adverse light conditions makes LiDAR a de-risking investment for premium OEMs. Camera sensors deliver rich color and pixel density, but they falter in diffuse glare. Therefore, automakers fuse them with radar Doppler to stabilize pedestrian trajectories. Ultrasonic and IMU units fill specific niches, yet their limited range means they augment, not replace, core perception.
Demand for LiDAR remains skewed toward upper-trim crossovers and robotaxis, where customers are willing to tolerate higher costs for hands-free operation. Radar's incremental generational cost drops cement its dominance in mass-market ADAS. Still, as solid-state LiDAR units approach USD 300, mid-segment EVs plan to adopt them in the 2027 refresh. Suppliers compete on angular resolution and eye-safe wavelengths, while regulatory clarity on 1,550-nanometer lasers could broaden design windows. Consequently, LiDAR's dollar growth outstrips that of radar, reshaping supplier shares within the sensor fusion market in autonomous vehicles.
Hardware accounted for 60.12% of revenue in 2025, encompassing transceivers, optics, and microcontrollers. Yet, the software CAGR of 21.34% outpaces hardware as automakers pivot to neural-network fusion that requires constant fleet-scale retraining. The sensor fusion market size in autonomous vehicles for software services covers calibration, mapping, and cybersecurity updates, forming recurring revenue streams. Continental's Advanced Radar Sensor 540 compresses raw data to reduce Ethernet traffic by 70%, demonstrating a co-design ethos where edge preprocessing and cloud inference split workloads.
Services such as Mobileye's Road Experience Management turn anonymized drive data into high-definition maps, monetizing usage beyond initial equipment sales. Over-the-air management platforms expand attach rates, especially in subscription-oriented EV brands. Hardware margins compress under price pressure, while certified middleware commands a premium. The shift alters bargaining power: suppliers offering full-stack solutions capture a bigger share of the sensor fusion market in the autonomous vehicle profit pool than pure-play component vendors.
Complete Report Scope:
- By Sensor Type
- LiDAR
- Radar
- Camera
- Ultrasonic
- Inertial Measurement Units (IMU)
- By Component
- Hardware
- Software
- Services
- By Technology
- MEMS Sensors
- Non-MEMS Sensors
- By Level of Automation
- Level 1
- Level 2
- Level 3
- Level 4
- Level 5
- By Propulsion Type
- Internal Combustion Engine Vehicles
- Battery Electric Vehicles
- Hybrid Electric Vehicles
- Fuel Cell Electric Vehicles
- By Vehicle Type
- Passenger Cars
- Light Commercial Vehicles
- Heavy Commercial Vehicles
- Other Autonomous Vehicles
- By Geography
- North America
- United States
- Canada
- Mexico
- South America
- Brazil
- Argentina
- Rest of South America
- Europe
- Germany
- United Kingdom
- France
- Italy
- Spain
- Rest of Europe
- Asia-Pacific
- China
- Japan
- India
- South Korea
- Australia
- Rest of Asia-Pacific
- Middle East and Africa
- Middle East
- Saudi Arabia
- United Arab Emirates
- Turkey
- Rest of Middle East
- Africa
- South Africa
- Nigeria
- Egypt
- Rest of Africa
- Middle East
- North America
Geography Analysis
Asia Pacific captured 41.88% share and will hold a 21.57% CAGR, buoyed by China's Level 2 mandate in 2025 and Japan's USD 670 million Society 5.0 V2X budget. The region's manufacturing clusters compress iteration loops between sensor fabs and vehicle assembly lines.
North America remains a technology testbed, with the FCC allocating 30 MHz C-V2X spectrum and California green-lighting driverless robotaxis in Los Angeles and San Francisco. Europe enforces UNECE regulations and stimulus for zero-fatality targets, sustaining premium OEM spending despite softer unit demand.
South America, the Middle East, and Africa lag, but they operate lighthouse pilots in Brazil's Sao Paulo and the UAE's Dubai logistics corridors. Currency volatility and infrastructure gaps defer mass rollouts, but falling LiDAR costs could unlock price-sensitive applications by 2028. Overall, geographic diversification cushions cyclical shocks, stabilizing revenue visibility for the sensor fusion market in autonomous vehicles.
- Robert Bosch GmbH
- Continental AG
- ZF Friedrichshafen AG
- NXP Semiconductors N.V.
- Infineon Technologies AG
- STMicroelectronics N.V.
- Denso Corporation
- Aptiv PLC
- Texas Instruments Incorporated
- Analog Devices, Inc.
- NVIDIA Corporation
- Mobileye Global Inc.
- Valeo SA
- Renesas Electronics Corporation
- ON Semiconductor Corporation
- TDK Corporation
- TE Connectivity Ltd.
- Elmos Semiconductor SE
- LeddarTech Inc.
- BASELABS GmbH
- Kionix, Inc. (Rohm Co., Ltd.)
- CEVA, Inc.
- Memsic, Inc.
- Sensata Technologies, Inc.
- Velodyne Lidar, Inc.
- Innoviz Technologies Ltd.
- Ouster, Inc.
- Quanergy Systems, Inc.
- PlusAI Inc.
Additional Benefits:
- The market estimate (ME) sheet in Excel format
- 3 months of analyst support
TABLE OF CONTENTS
1 INTRODUCTION
- 1.1 Study Assumptions and Market Definition
- 1.2 Scope of the Study
2 RESEARCH METHODOLOGY
3 EXECUTIVE SUMMARY
4 MARKET LANDSCAPE
- 4.1 Market Overview
- 4.2 Market Drivers
- 4.2.1 Mainstream ADAS Mandates Accelerating Multi-Sensor Adoption
- 4.2.2 Declining Solid-State LiDAR Costs Below USD 400 per Unit
- 4.2.3 In-Vehicle Edge-AI Chipsets Enabling <10 ms Fusion Latency
- 4.2.4 Over-the-Air Regulation Requiring Continuous Perception Updates
- 4.2.5 Smart-City V2X Pilots Demanding High-Fidelity Environmental Models
- 4.2.6 Insurance Telematics Incentives for Fused Safety-Score APIs
- 4.3 Market Restraints
- 4.3.1 Absence of Global Sensor-Data Standards Across OEMs
- 4.3.2 Double-Digit Tariffs on LiDAR and IMU Imports in 2025
- 4.3.3 Real-Time Cyber-Security Certification Bottlenecks
- 4.3.4 Processor Power-Budget Limits in BEVs Below 20 W
- 4.4 Industry Value Chain Analysis
- 4.5 Regulatory Landscape
- 4.6 Technological Outlook
- 4.7 Impact of Macroeconomic Factors
- 4.8 Porter's Five Forces Analysis
- 4.8.1 Bargaining Power of Suppliers
- 4.8.2 Bargaining Power of Buyers
- 4.8.3 Threat of New Entrants
- 4.8.4 Intensity of Competitive Rivalry
- 4.8.5 Threat of Substitute Products
- 4.9 Key Patents and Research Activities
- 4.10 Major and Emerging Applications
- 4.10.1 Adaptive Cruise Control (ACC)
- 4.10.2 Autonomous Emergency Braking (AEB)
- 4.10.3 Electronic Stability Control (ESC)
- 4.10.4 Forward Collision Warning (FCW)
- 4.10.5 Other Applications
5 MARKET SIZE AND GROWTH FORECASTS (VALUE)
- 5.1 By Sensor Type
- 5.1.1 LiDAR
- 5.1.2 Radar
- 5.1.3 Camera
- 5.1.4 Ultrasonic
- 5.1.5 Inertial Measurement Units (IMU)
- 5.2 By Component
- 5.2.1 Hardware
- 5.2.2 Software
- 5.2.3 Services
- 5.3 By Technology
- 5.3.1 MEMS Sensors
- 5.3.2 Non-MEMS Sensors
- 5.4 By Level of Automation
- 5.4.1 Level 1
- 5.4.2 Level 2
- 5.4.3 Level 3
- 5.4.4 Level 4
- 5.4.5 Level 5
- 5.5 By Propulsion Type
- 5.5.1 Internal Combustion Engine Vehicles
- 5.5.2 Battery Electric Vehicles
- 5.5.3 Hybrid Electric Vehicles
- 5.5.4 Fuel Cell Electric Vehicles
- 5.6 By Vehicle Type
- 5.6.1 Passenger Cars
- 5.6.2 Light Commercial Vehicles
- 5.6.3 Heavy Commercial Vehicles
- 5.6.4 Other Autonomous Vehicles
- 5.7 By Geography
- 5.7.1 North America
- 5.7.1.1 United States
- 5.7.1.2 Canada
- 5.7.1.3 Mexico
- 5.7.2 South America
- 5.7.2.1 Brazil
- 5.7.2.2 Argentina
- 5.7.2.3 Rest of South America
- 5.7.3 Europe
- 5.7.3.1 Germany
- 5.7.3.2 United Kingdom
- 5.7.3.3 France
- 5.7.3.4 Italy
- 5.7.3.5 Spain
- 5.7.3.6 Rest of Europe
- 5.7.4 Asia-Pacific
- 5.7.4.1 China
- 5.7.4.2 Japan
- 5.7.4.3 India
- 5.7.4.4 South Korea
- 5.7.4.5 Australia
- 5.7.4.6 Rest of Asia-Pacific
- 5.7.5 Middle East and Africa
- 5.7.5.1 Middle East
- 5.7.5.1.1 Saudi Arabia
- 5.7.5.1.2 United Arab Emirates
- 5.7.5.1.3 Turkey
- 5.7.5.1.4 Rest of Middle East
- 5.7.5.2 Africa
- 5.7.5.2.1 South Africa
- 5.7.5.2.2 Nigeria
- 5.7.5.2.3 Egypt
- 5.7.5.2.4 Rest of Africa
- 5.7.5.1 Middle East
- 5.7.1 North America
6 COMPETITIVE LANDSCAPE
- 6.1 Market Concentration
- 6.2 Strategic Moves
- 6.3 Market Share Analysis
- 6.4 Company Profiles (includes Global level Overview, Market level overview, Core Segments, Financials as available, Strategic Information, Market Rank/Share for key companies, Products and Services, and Recent Developments)
- 6.4.1 Robert Bosch GmbH
- 6.4.2 Continental AG
- 6.4.3 ZF Friedrichshafen AG
- 6.4.4 NXP Semiconductors N.V.
- 6.4.5 Infineon Technologies AG
- 6.4.6 STMicroelectronics N.V.
- 6.4.7 Denso Corporation
- 6.4.8 Aptiv PLC
- 6.4.9 Texas Instruments Incorporated
- 6.4.10 Analog Devices, Inc.
- 6.4.11 NVIDIA Corporation
- 6.4.12 Mobileye Global Inc.
- 6.4.13 Valeo SA
- 6.4.14 Renesas Electronics Corporation
- 6.4.15 ON Semiconductor Corporation
- 6.4.16 TDK Corporation
- 6.4.17 TE Connectivity Ltd.
- 6.4.18 Elmos Semiconductor SE
- 6.4.19 LeddarTech Inc.
- 6.4.20 BASELABS GmbH
- 6.4.21 Kionix, Inc. (Rohm Co., Ltd.)
- 6.4.22 CEVA, Inc.
- 6.4.23 Memsic, Inc.
- 6.4.24 Sensata Technologies, Inc.
- 6.4.25 Velodyne Lidar, Inc.
- 6.4.26 Innoviz Technologies Ltd.
- 6.4.27 Ouster, Inc.
- 6.4.28 Quanergy Systems, Inc.
- 6.4.29 PlusAI Inc.
7 MARKET OPPORTUNITIES AND FUTURE OUTLOOK
- 7.1 White-space and Unmet-need Assessment

