PUBLISHER: Mordor Intelligence | PRODUCT CODE: 2100768

PUBLISHER: Mordor Intelligence | PRODUCT CODE: 2100768
UI/UX - Market Share Analysis, Industry Trends & Statistics, Growth Forecasts (2026 - 2031)
According to Mordor Intelligence, the UI/UX market size is projected to be USD 1.98 billion in 2025, USD 2.91 billion in 2026, and reach USD 11.66 billion by 2031, growing at a CAGR of 32% from 2026 to 2031.
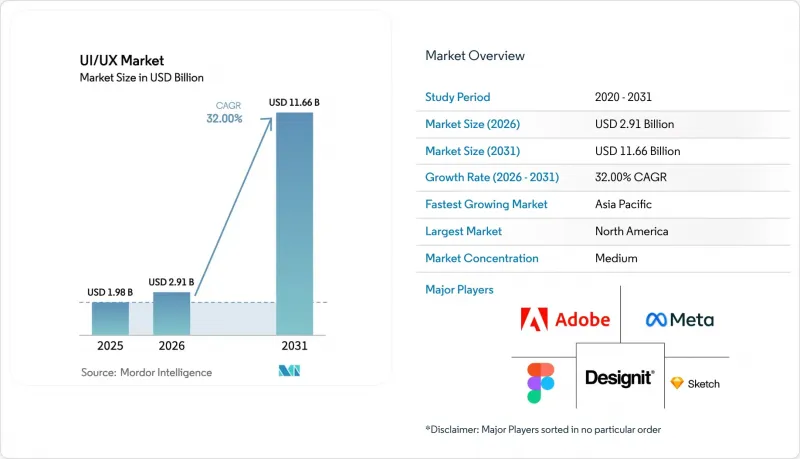
This report is Segmented by Deployment Model (Cloud-Based, and On-Premises), Organization Size (Large Enterprises, Mid-Sized Enterprises, and Small and Micro Enterprises), End-Use Industry (E-Commerce and Retail, Healthcare and Life Sciences, Banking Financial Services and Insurance, and More), Platform (Mobile Applications, and More), and Geography. The Market Forecasts are Provided in Terms of Value (USD).
Global UI/UX Market Trends and Insights
Proliferation of Digital-Transformation Programs
Digital-transformation budgets climbed to 7.5% of revenue in 2025, a level Deloitte identified as the breakpoint between CX leaders and laggards. Technology outlays grew 4.6% that year, and 91% of enterprises intend to raise digital spending in 2026, according to Forrester. UI/UX platforms have therefore shifted from discretionary purchases to essential line items locked into multi-year roadmaps. Firms delaying investment risk fragmented web, mobile, and voice journeys that erode customer value gains.
Surge in Mobile-Commerce Adoption
Southeast Asia's e-commerce gross merchandise value reached USD 185 billion in 2025, with video commerce delivering 25% of transactions and average order values near USD 6-7. Mobile-first consumers drove 70% year-over-year growth in visual search, and 62% reported that AI recommendations shaped purchasing choices. Design teams now optimize thumb-zone navigation and conversational checkouts rather than resizing desktop layouts, turning mobile UX into the primary revenue interface.
Shortage of Skilled UI/UX Talent
Experis UK reported that 76% of firms struggled to fill UI/UX roles in 2025, and Germany's gap jumped from 28% to 61% in one year. Autodesk noted a parallel rise in talent scarcity, with 58% of companies citing the shortage as a growth barrier. The mismatch between academic curricula and industry demand forces enterprises to poach scarce specialists or retrain adjacent staff, delaying design-system rollouts and slowing the UI/UX market.
Other drivers and restraints analyzed in the detailed report include:
- Enterprise Focus on CX KPIs and NPS
- Accessibility Legislation (WCAG 3.0) Redesign Mandates
- High Subscription Cost of Premium Tool Suites
For complete list of drivers and restraints, kindly check the Table Of Contents.
Segment Analysis
Cloud solutions commanded 68.19% UI/UX market share in 2025 and are growing at 32.98% through 2031. Figma recorded 93% adoption at Ramp, a fintech firm, demonstrating that synchronous editing and instant developer handoff drive preference for browser-based platforms. On-premises systems persist in defense, healthcare, and regulated finance, yet hybrid approaches that sync local storage with cloud collaboration are stepping-stones to full migration.
API-enabled design tokens and automated accessibility checks shorten release cycles, while desktop tools require manual file transfers that introduce errors. Vendors are phasing out perpetual licenses in favour of cloud subscriptions, and regulators now accept certified cloud security, eroding the remaining on-premises foothold. Enterprises staying offline face slower iteration and diminished competitiveness, a reality reshaping procurement policy across the UI/UX market.
Large Enterprises held 44.33% revenue in 2025, leveraging dedicated design-ops teams and volume discounts. Small and Micro Enterprises, however, are set to grow 32.56% annually thanks to no-code builders that remove front-end coding hurdles. The U.S. Chamber of Commerce found that 58% of small businesses used generative AI in 2025, while Canada's CFIB reported 44% AI adoption among SMBs.
Mid-Sized Enterprises face a pricing squeeze: big enough to need advanced features yet too small for enterprise rates. The UK Digital Adoption Taskforce highlighted cost, skills, and integration as central barriers. Vendors offering tiered plans that align to maturity stages can win across the spectrum, whereas flat enterprise pricing risks ceding the fast-growing SMB slice of the UI/UX market.
Complete Report Scope:
- By Deployment Model
- Cloud-Based
- On-Premises
- By Organization Size
- Large Enterprises
- Mid-Sized Enterprises
- Small and Micro Enterprises
- By End-Use Industry
- E-Commerce and Retail
- Healthcare and Life Sciences
- Banking, Financial Services and Insurance
- Education and EdTech
- IT and Telecom
- Media and Entertainment
- Government and Public Sector
- Other End-Use Industries
- By Platform
- Mobile Applications
- Web Applications
- Desktop Software
- Voice and Conversational Interfaces
- AR/VR and Spatial Interfaces
- Automotive and IoT Displays
- By Geography
- North America
- United States
- Canada
- Mexico
- South America
- Brazil
- Argentina
- Chile
- Rest of South America
- Europe
- Germany
- France
- United Kingdom
- Russia
- Italy
- Spain
- Rest of Europe
- Asia-Pacific
- China
- Japan
- India
- South Korea
- Australia and New Zealand
- Rest of Asia-Pacific
- Middle East
- Saudi Arabia
- United Arab Emirates
- Turkey
- Rest of Middle East
- Africa
- South Africa
- Nigeria
- Kenya
- Rest of Africa
- North America
Geography Analysis
North America generated 38.98% of 2025 revenue, anchored by early design-ops adoption, WCAG-driven budgets, and venture funding that clusters around Silicon Valley and New York. Ninety-one percent of enterprises plan higher digital budgets in 2026, ranking CX among the top three priorities. State mandates in California and New York effectively set nationwide accessibility benchmarks, prompting widespread redesign.
Asia-Pacific is expanding at a 33.01% CAGR through 2031, buoyed by a USD 300 billion digital economy and a workforce with 79% AI skill penetration. Regional funding reached USD 8 billion in H1 2025, and data-center capacity is set to rise 180%, supporting AI-heavy design workflows. Country-specific drivers China's domestic tool ecosystem, Japan's automotive HMI focus, India's export-oriented IT services require vendors to localize language, pricing, and cloud integration to capture UI/UX market opportunities.
Europe's strict privacy and accessibility rules push companies toward localized design systems that bake in GDPR compliance. Germany, France, the UK, Italy, and Spain head spending, while the Nordics and Benelux see fast SMB uptake of no-code tools for government portals. South America, the Middle East, and Africa remain early-stage but are adding pilots in fintech, smart cities, and mobile money. As infrastructure improves, these regions will edge up in total UI/UX market share, although North America and Europe will retain innovation leadership.
- Adobe Inc.
- Figma, Inc.
- Sketch B.V.
- InVisionApp, Inc.
- Axure Software Solutions Inc.
- Balsamiq Studios LLC
- Proto.io Inc.
- UXPin Inc.
- Justinmind Inc.
- International Business Machines Corporation
- Oracle Corporation
- SAP SE
- Microsoft Corporation
- Google LLC
- Meta Platforms, Inc.
- Apple Inc.
- Atlassian Corporation Plc
- Designit A/S
- IDEO LP
- Ramotion LLC
- UX Studio Zrt.
- Nielsen Norman Group Inc.
- HCL Technologies Limited
- Cognizant Technology Solutions Corporation
- Zeplin Inc.
- Maze Design, Inc.
Additional Benefits:
- The market estimate (ME) sheet in Excel format
- 3 months of analyst support
TABLE OF CONTENTS
1 INTRODUCTION
- 1.1 Study Assumptions and Market Definition
- 1.2 Scope of the Study
2 RESEARCH METHODOLOGY
3 EXECUTIVE SUMMARY
4 MARKET LANDSCAPE
- 4.1 Market Overview
- 4.2 Market Drivers
- 4.2.1 Proliferation of Digital-Transformation Programs
- 4.2.2 Surge in Mobile-Commerce Adoption
- 4.2.3 Enterprise Focus on CX KPIs and NPS
- 4.2.4 Accessibility Legislation (WCAG 3.0) Redesign Mandates
- 4.2.5 Design Tokens Standardization for Multi-Brand Scalability
- 4.2.6 Edge-Rendered UI for Low-Latency Devices
- 4.3 Market Restraints
- 4.3.1 Shortage of Skilled UI/UX Talent
- 4.3.2 High Subscription Cost of Premium Tool Suites
- 4.3.3 Algorithmic Bias Risks in AI-Generated UX
- 4.3.4 Interoperability Gaps Across AR/VR and Classic Tooling
- 4.4 Industry Value-Chain Analysis
- 4.5 Regulatory Landscape
- 4.6 Technological Outlook
- 4.7 Impact of Macroeconomic Factors on the Market
- 4.8 Porter's Five Forces Analysis
- 4.8.1 Bargaining Power of Suppliers
- 4.8.2 Bargaining Power of Buyers
- 4.8.3 Threat of New Entrants
- 4.8.4 Threat of Substitutes
- 4.8.5 Competitive Rivalry
5 MARKET SIZE AND GROWTH FORECASTS (VALUE)
- 5.1 By Deployment Model
- 5.1.1 Cloud-Based
- 5.1.2 On-Premises
- 5.2 By Organization Size
- 5.2.1 Large Enterprises
- 5.2.2 Mid-Sized Enterprises
- 5.2.3 Small and Micro Enterprises
- 5.3 By End-Use Industry
- 5.3.1 E-Commerce and Retail
- 5.3.2 Healthcare and Life Sciences
- 5.3.3 Banking, Financial Services and Insurance
- 5.3.4 Education and EdTech
- 5.3.5 IT and Telecom
- 5.3.6 Media and Entertainment
- 5.3.7 Government and Public Sector
- 5.3.8 Other End-Use Industries
- 5.4 By Platform
- 5.4.1 Mobile Applications
- 5.4.2 Web Applications
- 5.4.3 Desktop Software
- 5.4.4 Voice and Conversational Interfaces
- 5.4.5 AR/VR and Spatial Interfaces
- 5.4.6 Automotive and IoT Displays
- 5.5 By Geography
- 5.5.1 North America
- 5.5.1.1 United States
- 5.5.1.2 Canada
- 5.5.1.3 Mexico
- 5.5.2 South America
- 5.5.2.1 Brazil
- 5.5.2.2 Argentina
- 5.5.2.3 Chile
- 5.5.2.4 Rest of South America
- 5.5.3 Europe
- 5.5.3.1 Germany
- 5.5.3.2 France
- 5.5.3.3 United Kingdom
- 5.5.3.4 Russia
- 5.5.3.5 Italy
- 5.5.3.6 Spain
- 5.5.3.7 Rest of Europe
- 5.5.4 Asia-Pacific
- 5.5.4.1 China
- 5.5.4.2 Japan
- 5.5.4.3 India
- 5.5.4.4 South Korea
- 5.5.4.5 Australia and New Zealand
- 5.5.4.6 Rest of Asia-Pacific
- 5.5.5 Middle East
- 5.5.5.1 Saudi Arabia
- 5.5.5.2 United Arab Emirates
- 5.5.5.3 Turkey
- 5.5.5.4 Rest of Middle East
- 5.5.6 Africa
- 5.5.6.1 South Africa
- 5.5.6.2 Nigeria
- 5.5.6.3 Kenya
- 5.5.6.4 Rest of Africa
- 5.5.1 North America
6 COMPETITIVE LANDSCAPE
- 6.1 Market Concentration
- 6.2 Strategic Moves
- 6.3 Market Share Analysis
- 6.4 Company Profiles (includes Global Level Overview, Market Level Overview, Core Segments, Financials as available, Strategic Information, Market Rank/Share, Products and Services, Recent Developments)
- 6.4.1 Adobe Inc.
- 6.4.2 Figma, Inc.
- 6.4.3 Sketch B.V.
- 6.4.4 InVisionApp, Inc.
- 6.4.5 Axure Software Solutions Inc.
- 6.4.6 Balsamiq Studios LLC
- 6.4.7 Proto.io Inc.
- 6.4.8 UXPin Inc.
- 6.4.9 Justinmind Inc.
- 6.4.10 International Business Machines Corporation
- 6.4.11 Oracle Corporation
- 6.4.12 SAP SE
- 6.4.13 Microsoft Corporation
- 6.4.14 Google LLC
- 6.4.15 Meta Platforms, Inc.
- 6.4.16 Apple Inc.
- 6.4.17 Atlassian Corporation Plc
- 6.4.18 Designit A/S
- 6.4.19 IDEO LP
- 6.4.20 Ramotion LLC
- 6.4.21 UX Studio Zrt.
- 6.4.22 Nielsen Norman Group Inc.
- 6.4.23 HCL Technologies Limited
- 6.4.24 Cognizant Technology Solutions Corporation
- 6.4.25 Zeplin Inc.
- 6.4.26 Maze Design, Inc.
7 MARKET OPPORTUNITIES AND FUTURE OUTLOOK
- 7.1 White-Space and Unmet-Need Assessment

