PUBLISHER: Mordor Intelligence | PRODUCT CODE: 2113294

PUBLISHER: Mordor Intelligence | PRODUCT CODE: 2113294
Permanent Magnet Motor - Market Share Analysis, Industry Trends & Statistics, Growth Forecasts (2026 - 2031)
According to Mordor Intelligence, the permanent magnet motor market stood at USD 57.94 billion in 2026 and is forecast to reach USD 89.47 billion by 2031, translating to a 9.08% CAGR over the period.
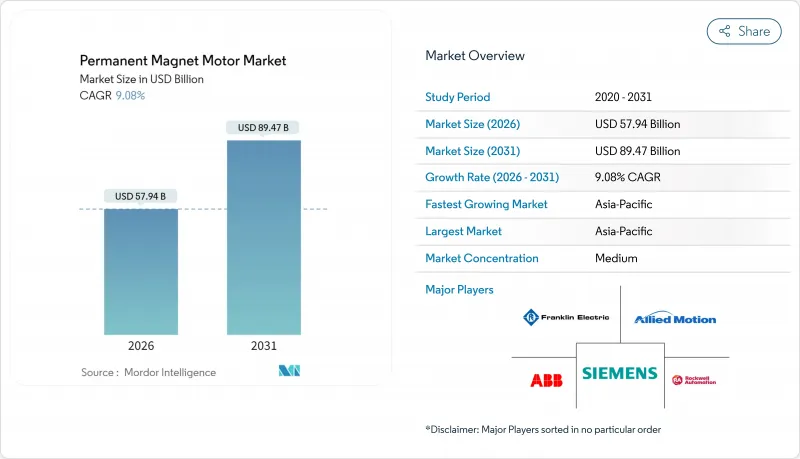
This report is Segmented by Motor Type (Permanent Magnet AC Motor, Permanent Magnet DC Motor, and More), Magnetic Material Type (Neodymium Iron Boron, Samarium Cobalt, and More), Power Rating (Up To 4 KW, 4-22 KW, and More), Cooling Method (Air-Cooled, Liquid-Cooled, and More), End-User Industry (Automotive, and More), and Geography. The Market Forecasts are Provided in Terms of Value (USD).
Global Permanent Magnet Motor Market Trends and Insights
Increased Motor Efficiency Due to Permanent Magnets
Permanent-magnet synchronous motors deliver 94-97% full-load efficiency in the 4-22 kW class, outpacing comparable induction designs by up to 5 percentage points, a delta that trims industrial payback periods below 18 months. Variable-speed duty cycles amplify the savings because rotor copper losses disappear when magnet excitation replaces winding current, a fit with ISO 50001 programs that prize low part-load losses. The European Union's Ecodesign Directive widened the scope of minimum efficiency rules in 2024, triggering retrofits in space-constrained refrigeration and ventilation equipment. Above 200 kW the cost-benefit narrows, yet niches such as regenerative cranes still justify magnet adoption where frequent cycling dominates lifecycle cost.
Rising Demand for Electric Vehicles
Global battery-electric output reached 14 million vehicles in 2025, and 78% used permanent-magnet traction motors for superior torque density and regeneration efficiency. Chinese automakers now combine hairpin stators with segmented-magnet rotors to slash eddy losses, enabling continuous ratings above 150 kW without liquid cooling. Tesla's reluctance-assisted design trimmed neodymium content by 20%, prompting rivals to accelerate dysprosium-free chemistries. Commercial fleets amplify demand: Daimler Truck and Volvo Group plan more than 50,000 electric heavy vehicles each year by 2027, absorbing over 1,200 metric tons of NdFeB magnets annually.
Expansion of Renewable Energy Generation Using PM Generators
Offshore wind projects commissioned in 2025 favour direct-drive permanent-magnet generators rated 12-15 MW, eliminating gearboxes and pushing turbine availability above 97%. Vestas and GE Vernova locked in multi-year supply deals covering up to 4,000 metric tons of NdFeB per year through 2028. Hydropower upgrades that replace salient-pole alternators with permanent-magnet synchronous units add 4-6 percentage points of part-load efficiency, boosting generation by up to 20 GWh annually at 100 MW stations. Carbon-credit monetization of reduced curtailment further sweetens project economics in OECD power markets.
Other drivers and restraints analyzed in the detailed report include:
- Stringent Energy-Efficiency Regulations
- Diminishing Availability of Rare-Earth Metals
- High Initial Cost of PM Motors
For complete list of drivers and restraints, kindly check the Table Of Contents.
Segment Analysis
Permanent magnet AC machines generated 48.03% of revenue in 2025, reflecting their entrenched role in factory automation and HVAC installations where three-phase grids and mature inverter ecosystems simplify deployment. The permanent magnet motor market is witnessing double-digit expansion of brushless DC alternatives that pair naturally with 48-volt subsystems in electric vehicles and collaborative robots. Manufacturers like Continental have demonstrated trapezoidal back-EMF profiles that reduce semiconductor switching losses by up to 12%, a performance gain that shortens controller cost recovery cycles. Legacy permanent magnet DC designs linger in small electronics, yet their share contracts as lithium-ion packs standardize around voltages that reward sensorless brushless topologies with longer lifespans. Hermetic motors sit at the intersection of the refrigeration boom and heat-pump retrofits, drawing interest because sealed stators eliminate refrigerant leakage paths during repeated thermal cycling.
Brushless architectures also reshape maintenance economics. Absence of brushes removes sparking and dust, extending overhaul intervals in food-grade conveyors and medical ventilators where cleanliness is paramount. The permanent magnet motor market size for brushless platforms in auxiliary vehicle systems is expected to maintain momentum because onboard electronics already support field-oriented control. Conversely, permanent magnet AC remains favoured in grid-tied equipment that demands smooth sinusoidal torque and accepts slightly larger frames to simplify compliance with electromagnetic compatibility norms. The net effect is parallel growth corridors rather than outright substitution, with design engineers selecting form factors according to duty cycle and inverter sophistication rather than magnet cost alone.
Neodymium-iron-boron retained 52.40% share in 2025, thanks to energy products above 35 MGOe that let designers trim rotor diameters and still hit torque targets. Yet the permanent magnet motor market now tracks a rapid 10.04% CAGR for nanocomposite NdFeB, a chemistry that deposits terbium or dysprosium at grain boundaries, raising coercivity by up to 30% while cutting heavy rare-earth loadings nearly in half. These alloys shield OEMs from dysprosium price spikes that exceeded 60% in 2024-2025, and they allow operation beyond 180 °C in high-speed spindles without demagnetization. Aerospace and defense users still specify samarium-cobalt for thermal stability above 200 °C despite material costs roughly triple those of NdFeB. Ferrite, though lower in energy density, draws appliance and irrigation-pump producers that compete in regions where electricity tariffs sit under USD 0.08 /kWh, extending ROI thresholds beyond premium magnet economics.
Nanocomposite diffusion lines require tighter process controls and capital outlays upward of USD 10 million, but early movers lock in intellectual property barriers that deter fast-follower entry. The permanent magnet motor market share for ferrite will likely stabilize rather than collapse, helped by hybrid reluctance-assisted topologies that allow magnet mass reductions of 40-60%. Ultimately magnet mix bifurcates along performance and cost curves, matching technologically demanding automotive and industrial segments with nanocomposites, while volume-driven appliance makers optimize around ferrite.
Complete Report Scope:
- By Motor Type
- Permanent Magnet AC Motor
- Permanent Magnet DC Motor
- Brushless DC Motor
- Hermetic Motor
- By Magnetic Material Type
- Neodymium Iron Boron
- Samarium Cobalt
- Ferrite
- Nanocomposite NdFeB
- By Power Rating
- Up to 4 kW
- 4-22 kW
- 22-75 kW
- 75 kW and Above
- By Cooling Method
- Air-Cooled
- Liquid-Cooled
- Oil-Cooled
- Hybrid Cooling
- By End-User Industry
- Automotive
- Industrial Automation
- Energy (Wind and Hydro)
- Water and Wastewater Management
- Mining, Oil and Gas
- Aerospace and Defense
- Consumer Electronics
- Healthcare Equipment
- By Geography
- North America
- United States
- Canada
- Mexico
- Europe
- United Kingdom
- Germany
- France
- Italy
- Rest of Europe
- Asia-Pacific
- China
- Japan
- India
- South Korea
- Rest of Asia
- Middle East
- Israel
- Saudi Arabia
- United Arab Emirates
- Turkey
- Rest of Middle East
- Africa
- South Africa
- Egypt
- Rest of Africa
- South America
- Brazil
- Argentina
- Rest of South America
- North America
Geography Analysis
Asia-Pacific generated 43.50% of 2025 revenue and continues at a 9.58% CAGR as China's vertically integrated chain shrinks lead times to under eight weeks. Japan leverages samarium-cobalt prowess for aerospace contracts insulated from Chinese competition, while South Korea channels KRW 1.8 trillion (USD 1.35 billion) into hairpin winding and segmented rotor capacity for Hyundai and LG projects. India, buoyed by production-linked incentives, speeds adoption of 1-5 kW brushless hub motors in two-wheelers and auto-rickshaws that meet cost targets by substituting ferrite magnets.
North America and Europe invest heavily in supply-chain regionalization. The U.S. Department of Defense awarded USD 285 million for domestic separation and magnet facilities aiming to cut import reliance below 50% by 2030. The European Union's Critical Raw Materials Act requires 15% local rare-earth sourcing by 2028, spurring projects from Sweden's Norra Karr mine to German recycling plants. Inflation Reduction Act incentives push automakers toward U.S. magnet content despite a 12-18% procurement premium, since vehicles qualify for USD 7,500 consumer tax credits. Offshore wind ambitions of 60 GW by 2030 require vast permanent-magnet generator volumes, and long-term supply agreements already lock in price and availability.
Middle East and Africa plus South America show selective adoption. Gulf desalination plants retrofit high-pressure pumps with permanent magnet drives that cut energy use by up to 25%. Chilean and Peruvian copper mines trial conveyor and ventilation conversions that save over 1.2 GWh per site per year. Sub-Saharan markets remain price-sensitive but install solar-powered brushless DC irrigation pumps that avoid inverter costs, expanding crop yields where grid service is unreliable.
- ABB Ltd.
- Siemens AG
- Nidec Corporation
- Rockwell Automation, Inc.
- Toshiba Corporation
- WEG S.A.
- Wolong Electric Group
- Mitsubishi Electric Corporation
- Hitachi, Ltd.
- Regal Rexnord Corporation
- TECO Electric and Machinery
- Johnson Electric Holdings Ltd
- Allied Motion Technologies Inc
- Ametek, Inc.
- Franklin Electric Co., Inc.
- Continental AG
Additional Benefits:
- The market estimate (ME) sheet in Excel format
- 3 months of analyst support
TABLE OF CONTENTS
1 INTRODUCTION
- 1.1 Study Assumptions and Market Definition
- 1.2 Scope of the Study
2 RESEARCH METHODOLOGY
3 EXECUTIVE SUMMARY
4 MARKET LANDSCAPE
- 4.1 Market Overview
- 4.2 Market Drivers
- 4.2.1 Increased Motor Efficiency Due to Permanent Magnets
- 4.2.2 Rising Demand for Electric Vehicles
- 4.2.3 Stringent Energy-Efficiency Regulations
- 4.2.4 Expansion of Renewable Energy Generation Using PM Generators
- 4.2.5 Advances in Additive Manufacturing of Custom PM Rotors
- 4.2.6 Regionalization of Rare-Earth Magnet Supply Chains
- 4.3 Market Restraints
- 4.3.1 Diminishing Availability of Rare-Earth Metals
- 4.3.2 High Initial Cost of PM Motors
- 4.3.3 Demagnetization Risk at Elevated Operating Temperatures
- 4.3.4 Geopolitical Supply-Chain Concentration Risk
- 4.4 Industry Value Chain Analysis
- 4.5 Impact of Macroeconomic Factors on the Market
- 4.6 Regulatory Landscape
- 4.7 Technological Outlook
- 4.8 Porter's Five Forces Analysis
- 4.8.1 Threat of New Entrants
- 4.8.2 Bargaining Power of Buyers
- 4.8.3 Bargaining Power of Suppliers
- 4.8.4 Threat of Substitute Products
- 4.8.5 Intensity of Competitive Rivalry
5 MARKET SIZE AND GROWTH FORECASTS (VALUE)
- 5.1 By Motor Type
- 5.1.1 Permanent Magnet AC Motor
- 5.1.2 Permanent Magnet DC Motor
- 5.1.3 Brushless DC Motor
- 5.1.4 Hermetic Motor
- 5.2 By Magnetic Material Type
- 5.2.1 Neodymium Iron Boron
- 5.2.2 Samarium Cobalt
- 5.2.3 Ferrite
- 5.2.4 Nanocomposite NdFeB
- 5.3 By Power Rating
- 5.3.1 Up to 4 kW
- 5.3.2 4-22 kW
- 5.3.3 22-75 kW
- 5.3.4 75 kW and Above
- 5.4 By Cooling Method
- 5.4.1 Air-Cooled
- 5.4.2 Liquid-Cooled
- 5.4.3 Oil-Cooled
- 5.4.4 Hybrid Cooling
- 5.5 By End-User Industry
- 5.5.1 Automotive
- 5.5.2 Industrial Automation
- 5.5.3 Energy (Wind and Hydro)
- 5.5.4 Water and Wastewater Management
- 5.5.5 Mining, Oil and Gas
- 5.5.6 Aerospace and Defense
- 5.5.7 Consumer Electronics
- 5.5.8 Healthcare Equipment
- 5.6 By Geography
- 5.6.1 North America
- 5.6.1.1 United States
- 5.6.1.2 Canada
- 5.6.1.3 Mexico
- 5.6.2 Europe
- 5.6.2.1 United Kingdom
- 5.6.2.2 Germany
- 5.6.2.3 France
- 5.6.2.4 Italy
- 5.6.2.5 Rest of Europe
- 5.6.3 Asia-Pacific
- 5.6.3.1 China
- 5.6.3.2 Japan
- 5.6.3.3 India
- 5.6.3.4 South Korea
- 5.6.3.5 Rest of Asia
- 5.6.4 Middle East
- 5.6.4.1 Israel
- 5.6.4.2 Saudi Arabia
- 5.6.4.3 United Arab Emirates
- 5.6.4.4 Turkey
- 5.6.4.5 Rest of Middle East
- 5.6.5 Africa
- 5.6.5.1 South Africa
- 5.6.5.2 Egypt
- 5.6.5.3 Rest of Africa
- 5.6.6 South America
- 5.6.6.1 Brazil
- 5.6.6.2 Argentina
- 5.6.6.3 Rest of South America
- 5.6.1 North America
6 COMPETITIVE LANDSCAPE
- 6.1 Market Concentration
- 6.2 Strategic Moves
- 6.3 Market Share Analysis
- 6.4 Company Profiles (includes Global Level Overview, Market Level Overview, Core Segments, Financials as Available, Strategic Information, Market Rank/Share for Key Companies, Products and Services, and Recent Developments)
- 6.4.1 ABB Ltd.
- 6.4.2 Siemens AG
- 6.4.3 Nidec Corporation
- 6.4.4 Rockwell Automation, Inc.
- 6.4.5 Toshiba Corporation
- 6.4.6 WEG S.A.
- 6.4.7 Wolong Electric Group
- 6.4.8 Mitsubishi Electric Corporation
- 6.4.9 Hitachi, Ltd.
- 6.4.10 Regal Rexnord Corporation
- 6.4.11 TECO Electric and Machinery
- 6.4.12 Johnson Electric Holdings Ltd
- 6.4.13 Allied Motion Technologies Inc
- 6.4.14 Ametek, Inc.
- 6.4.15 Franklin Electric Co., Inc.
- 6.4.16 Continental AG
7 MARKET OPPORTUNITIES AND FUTURE OUTLOOK
- 7.1 White-Space and Unmet-Need Assessment

