PUBLISHER: Mordor Intelligence | PRODUCT CODE: 2113387

PUBLISHER: Mordor Intelligence | PRODUCT CODE: 2113387
Ion Chromatography - Market Share Analysis, Industry Trends & Statistics, Growth Forecasts (2026 - 2031)
According to Mordor Intelligence, the ion chromatography market size is estimated at USD 3.48 billion in 2026, and is expected to reach USD 4.21 billion by 2031, at a CAGR of 3.88% during the forecast period (2026-2031).
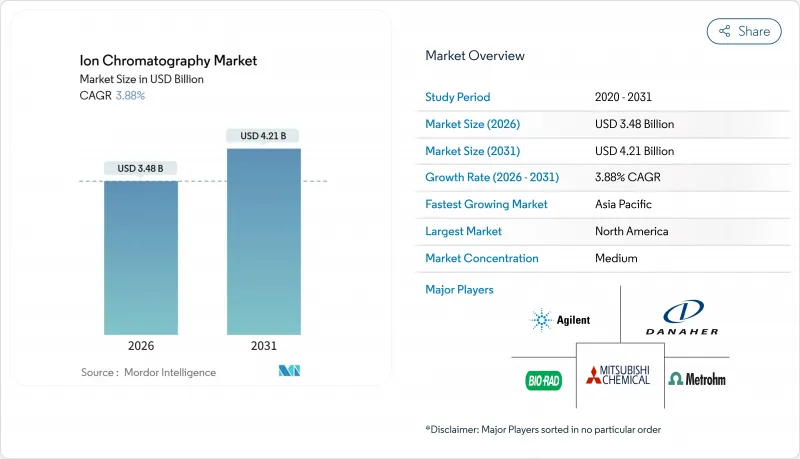
This report is Segmented by Product Type (Systems/Instruments, Consumables, Software & Services), Chromatography Technique (Ion-Exchange, Ion-Exclusion, Ion-Pair), Application (Environmental Testing, Pharmaceutical & Biopharmaceutical, and More), and Geography (North America, Europe, Asia-Pacific, Middle East & Africa, South America). The Market Forecasts are Provided in Terms of Value (USD).
Global Ion Chromatography Market Trends and Insights
Stricter Environmental and Water-Quality Regulations
Municipal utilities are overhauling laboratories after the U.S. Environmental Protection Agency's October 2024 interim health advisory set PFOA and PFOS limits at 4 parts per trillion, a sensitivity that legacy spectroscopy cannot achieve. Ion chromatography-tandem mass spectrometry has become the reference workflow, driving thousands of system upgrades across U.S. community water systems. The European Union's revised Drinking Water Directive, effective January 2026, requires quarterly monitoring of 20 PFAS compounds, thereby expanding the addressable base for high-capacity anion columns. China's draft wastewater standards, published in May 2025, require the reporting of anionic surfactants and hexavalent chromium, adding approximately 8,000 laboratories by 2028. Regulatory focus is widening to nanoplastics, where ion-exclusion chromatography separates polymer-degradation carboxylates more efficiently than optical spectroscopy, positioning the technique for broader adoption. Collectively, these mandates elevate the ion chromatography market by embedding the technology into routine regulatory compliance.
Pharmaceutical and Biopharma QC Demand Surge
Biologics manufacturing uses ion chromatography to quantify leachables from single-use bioreactors, residual host-cell proteins, and trace anions in buffers that can destabilize monoclonal antibodies. In February 2025, the U.S. FDA updated its analytical validation guidance, explicitly listing ion chromatography as a preferred method for determining the purity of injectable excipients. Biosimilar developers are shifting to ion-pair workflows for charge-variant analysis, which improves resolution for charged metabolites. China's regulator approved 47 biologic entities in 2025, each requiring multi-stage ion-chromatography testing that adds an estimated USD 120 million in annual consumable purchases.
High Capital and Maintenance Costs
A mid-specification instrument lists for USD 48,000-65,000, while installation and validation add USD 12,000-18,000. Consumables compound costs: Anion-exchange columns last 400-600 injections and sell for USD 800-1,200, while suppressors require quarterly replacement at approximately USD 600. Contract labs operating three systems report total annual ownership costs of nearly USD 100,000, straining budgets in India, Brazil, and certain parts of Africa. Shimadzu's pay-per-sample plan, introduced in Southeast Asia in late 2025, removes upfront capital but increases the five-year cost by 40% compared to direct purchase. Service contracts incur annual costs of USD 8,000-15,000, and slow field-service coverage in secondary cities can result in systems being idle for days. These economic limitations restrict the penetration of ion chromatography among small laboratories and slow the market's growth in emerging regions.
Other drivers and restraints analyzed in the detailed report include:
- Food and Beverage Safety Compliance Expansion
- Battery-Grade Electrolyte QC for Li-Ion Gigafactories
- Shortage of Trained Chromatographers
For complete list of drivers and restraints, kindly check the Table Of Contents.
Segment Analysis
In 2025, systems and instruments accounted for 58.11% of sales, the largest share of the ion chromatography market. Yet consumables are forecast to grow at a 5.81% CAGR through 2031, nearly double the growth of instruments, illustrating the pivot toward installed-base monetization. The average pharmaceutical lab running five platforms spends USD 40,000-55,000 annually on columns, suppressors, and eluent packs, creating predictable annuity streams that cushion vendor earnings. Thermo Fisher's Dionex IonPac AS11-HC column, introduced in March 2025, achieved 800-injection lifetimes, reducing the per-sample cost by 22% and drawing users closer to proprietary chemistry. Refurbished equipment brokers discount five-year-old systems by 40%, which increases pressure on new-unit volume, so vendors emphasize modular architectures that allow buyers to refresh detectors while reusing pumps and autosamplers. Consumable innovation also targets sustainability; Tosoh's September 2025 suppressor cartridge trims water use by 35%, a selling point for ISO 14001-aspiring labs.
Consumables dominance benefits vertically integrated suppliers that control resin production and suppressor assembly, whereas pure-play instrument makers struggle to capture recurring revenue. The software-and-services niche, although the smallest, is scaling steadily as cloud hosting, validation documentation, and predictive maintenance analytics become subscription-based items. Waters Empower 4 charges USD 3,200 per instrument annually, converting one-time licenses into recurring fees. The ion chromatography market size attached to software is therefore expected to outpace total market growth as laboratories shift to SaaS deployments that simplify audit readiness and cybersecurity compliance.
Complete Report Scope:
- By Product Type
- Systems / Instruments
- Consumables
- Software & Services
- By Chromatography Technique
- Ion-Exchange
- Ion-Exclusion
- Ion-Pair
- By Application
- Environmental Testing
- Pharmaceutical & Biopharmaceutical
- Food & Beverage Quality & Safety
- Other Research Applications
- By Geography
- North America
- United States
- Canada
- Mexico
- Europe
- Germany
- United Kingdom
- France
- Italy
- Spain
- Rest of Europe
- Asia-Pacific
- China
- Japan
- India
- Australia
- South Korea
- Rest of Asia-Pacific
- Middle East & Africa
- GCC
- South Africa
- Rest of Middle East & Africa
- South America
- Brazil
- Argentina
- Rest of South America
- North America
Geography Analysis
North America generated 39.64% of global revenue in 2025, driven by stringent PFAS enforcement and a large pharmaceutical base. The EPA's 4 ppt interim limit triggered a two-year spending surge that will taper by late 2027 as retrofits conclude. Canada added 14 QC labs in 2025 to serve U.S. supply-chain diversification efforts, maintaining mid-single-digit regional growth. Mexico's EV battery expansion, highlighted by Tesla's Monterrey gigafactory, introduces demand for electrolyte-quality testing, keeping instrument orders steady despite a mature overall market.
The Asia Pacific is the fastest-growing region, projected to grow at a 6.65% CAGR through 2031. Pharmacopeia standards. Semiconductor fabs in Taiwan and South Korea deploy inline ion chromatography monitors to reduce wafer defects, justifying investments of USD 85,000 per system. Japan's installed base is shifting toward higher consumable-intensity workflows, with Shimadzu and Tosoh leveraging localized service to win share.
Europe's growth hinges on environmental compliance. The Drinking Water Directive, effective January 2026, mandates quarterly testing for PFAS, sparking bulk procurements across municipal networks. Germany's chemical sector installed 140 systems in 2025 to meet new wastewater caps, a cycle expected to continue through 2028. The United Kingdom added 22 QC labs post-Brexit to align with Medicines and Healthcare products Regulatory Agency guidelines. Southern Europe lags due to fragmented utilities, but cohesion funds are underwriting lab modernization to 2029. The Middle East and Africa remain nascent but show promise as desalination plants adopt anion monitoring; Saudi Arabia's ACWA Power equipped six facilities in 2025. South America progresses unevenly; Brazil's nitrate regulations for processed meats provide a steady, if modest, growth anchor.
- Agilent Technologies
- Bio-Rad Laboratories
- Cecil Instruments
- Danaher
- East & West Analytical Instruments
- Hitachi High-Tech Corp.
- MembraPure
- Merck KGaA (MilliporeSigma)
- Metrohm
- Mitsubishi Chemical
- PerkinElmer
- Phenomenex
- Qingdao Puren Instrument
- Qingdao Shenghan Chromatograph Tech
- Shimadzu
- Sykam GmbH
- Thermo Fisher Scientific
- Tosoh
- Waters Corporation
- YMC Co., Ltd.
Additional Benefits:
- The market estimate (ME) sheet in Excel format
- 3 months of analyst support
TABLE OF CONTENTS
1 Introduction
- 1.1 Study Assumptions & Market Definition
- 1.2 Scope of the Study
2 Research Methodology
3 Executive Summary
4 Market Landscape
- 4.1 Market Overview
- 4.2 Market Drivers
- 4.2.1 Stricter Environmental & Water-Quality Regulations
- 4.2.2 Pharmaceutical & Biopharma QC Demand Surge
- 4.2.3 Food & Beverage Safety Compliance Expansion
- 4.2.4 Battery-Grade Electrolyte QC for Li-ion Gigafactories
- 4.2.5 AI-driven Method Automation Lowering OPEX
- 4.2.6 Micro-Chip IC For Point-Of-Use Water Analysis
- 4.3 Market Restraints
- 4.3.1 High Capital & Maintenance Costs
- 4.3.2 Shortage of Trained Chromatographers
- 4.3.3 Resin & Suppressor Supply-chain Fragility
- 4.3.4 Availability of Alternative Techniques
- 4.4 Regulatory Landscape
- 4.5 Technological Outlook
- 4.6 Porter's Five Forces Analysis
- 4.6.1 Threat of New Entrants
- 4.6.2 Bargaining Power of Buyers
- 4.6.3 Bargaining Power of Suppliers
- 4.6.4 Threat of Substitutes
- 4.6.5 Competitive Rivalry
5 Market Size & Growth Forecasts
- 5.1 By Product Type
- 5.1.1 Systems / Instruments
- 5.1.2 Consumables
- 5.1.3 Software & Services
- 5.2 By Chromatography Technique
- 5.2.1 Ion-Exchange
- 5.2.2 Ion-Exclusion
- 5.2.3 Ion-Pair
- 5.3 By Application
- 5.3.1 Environmental Testing
- 5.3.2 Pharmaceutical & Biopharmaceutical
- 5.3.3 Food & Beverage Quality & Safety
- 5.3.4 Other Research Applications
- 5.4 By Geography
- 5.4.1 North America
- 5.4.1.1 United States
- 5.4.1.2 Canada
- 5.4.1.3 Mexico
- 5.4.2 Europe
- 5.4.2.1 Germany
- 5.4.2.2 United Kingdom
- 5.4.2.3 France
- 5.4.2.4 Italy
- 5.4.2.5 Spain
- 5.4.2.6 Rest of Europe
- 5.4.3 Asia-Pacific
- 5.4.3.1 China
- 5.4.3.2 Japan
- 5.4.3.3 India
- 5.4.3.4 Australia
- 5.4.3.5 South Korea
- 5.4.3.6 Rest of Asia-Pacific
- 5.4.4 Middle East & Africa
- 5.4.4.1 GCC
- 5.4.4.2 South Africa
- 5.4.4.3 Rest of Middle East & Africa
- 5.4.5 South America
- 5.4.5.1 Brazil
- 5.4.5.2 Argentina
- 5.4.5.3 Rest of South America
- 5.4.1 North America
6 Competitive Landscape
- 6.1 Market Concentration
- 6.2 Market Share Analysis
- 6.3 Company Profiles (includes Global level Overview, Market-level Overview, Core Segments, Financials, Strategic Information, Market Rank/Share, Products & Services, Recent Developments)
- 6.3.1 Agilent Technologies
- 6.3.2 Bio-Rad Laboratories Inc
- 6.3.3 Cecil Instruments
- 6.3.4 Danaher Corporation (Cytiva)
- 6.3.5 East & West Analytical Instruments
- 6.3.6 Hitachi High-Tech Corp.
- 6.3.7 MembraPure GmbH
- 6.3.8 Merck KGaA (MilliporeSigma)
- 6.3.9 Metrohm AG
- 6.3.10 Mitsubishi Chemical Corporation
- 6.3.11 PerkinElmer Inc.
- 6.3.12 Phenomenex
- 6.3.13 Qingdao Puren Instrument
- 6.3.14 Qingdao Shenghan Chromatograph Tech
- 6.3.15 Shimadzu Corporation
- 6.3.16 Sykam GmbH
- 6.3.17 Thermo Fisher Scientific
- 6.3.18 Tosoh Bioscience
- 6.3.19 Waters Corporation
- 6.3.20 YMC Co., Ltd.
7 Market Opportunities & Future Outlook
- 7.1 White-space & Unmet-need Assessment

