PUBLISHER: Mordor Intelligence | PRODUCT CODE: 2113411

PUBLISHER: Mordor Intelligence | PRODUCT CODE: 2113411
Mobile Crushers And Screeners - Market Share Analysis, Industry Trends & Statistics, Growth Forecasts (2026 - 2031)
According to Mordor Intelligence, the mobile crushers and screeners market size is expected to increase from USD 3.26 billion in 2025 to USD 3.44 billion in 2026 and reach USD 4.45 billion by 2031, growing at a CAGR of 5.26% over 2026-2031.
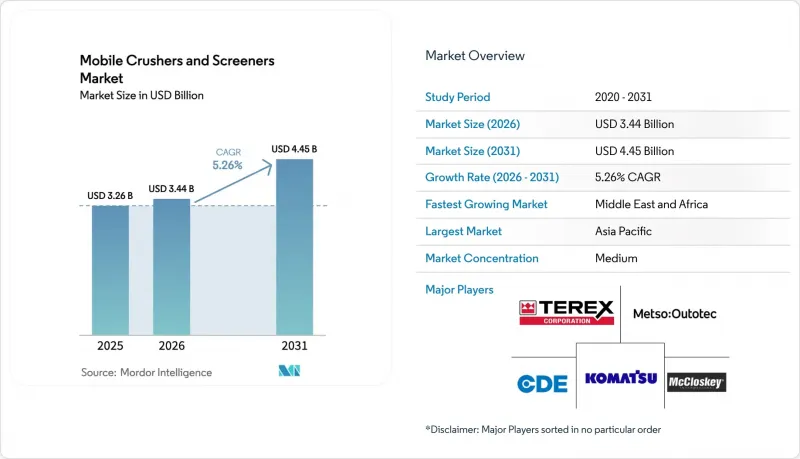
This report is Segmented by Type (New, and Refurbished), Machinery Type (Mobile Crushers, and Mobile Screeners), End-User Industry (Mining and Metallurgy, Aggregate Processing, Recycling, and More), Capacity Range (Up To 200 T/H, and More), Power Source (Diesel-Hydraulic, and Fully Electric), and Geography. The Market Forecasts are Provided in Terms of Value (USD).
Global Mobile Crushers And Screeners Market Trends and Insights
Growing Demand for On-Site Crushing to Cut Hauling Costs
Mobile jaw and cone crushers are increasingly stationed within meters of excavation faces, trimming diesel consumption for haul trucks and shortening project schedules by up to one quarter. Rental companies are scaling mixed fleets that can be dispatched on 30-day contracts, converting what was a USD 500,000-USD 1.5 million capital outlay into a predictable operating expense. Sunbelt Rentals generated GBP 8.98 billion (USD 11.4 billion) in the fiscal year ended April 2024, underscoring robust fleet utilization. Persistent construction-equipment operator growth projected by the U.S. Bureau of Labor Statistics further supports long-term equipment demand.
Expansion of Construction Sector Amid Urbanization
Metro rail, expressway, and brownfield redevelopment projects across India, Indonesia, and the Gulf states increasingly favour track-mounted crushers that can be relocated weekly as building phases advance. India's National Infrastructure Pipeline earmarked USD 1.4 trillion for projects through 2025. Mobile screeners also free 2,000-3,000 square meters of scarce city land otherwise occupied by stationary plants, a decisive advantage where zoning restricts heavy industrial footprints.
High Initial Capital Expenditure
Mid-capacity mobile crushers cost USD 500,000-USD 1.5 million, a hurdle for buyers in regions where equipment-finance interest rates remain elevated. Rental penetration still sits below 15% of construction-equipment spending in many African and Southeast Asian nations, hampering access to modern low-emission fleets. Although OEMs such as Metso now market modular platforms that reduce investment per application, high borrowing costs identified in International Monetary Fund outlooks continue to defer outright purchases.
Other drivers and restraints analyzed in the detailed report include:
- Rising Mineral Extraction in Emerging Economies
- Adoption of Hybrid-Electric Mobile Crushers for Emission Compliance
- Volatility in Raw Material Prices Impacting Equipment Cost
For complete list of drivers and restraints, kindly check the Table Of Contents.
Segment Analysis
Refurbished equipment accounted for a growing slice of the mobile crushers and screeners market in 2025 and is projected to climb at a 6.90% CAGR through 2031. The segment benefits from certified rebuild programs that deliver up to 90% of new-unit performance at 40-60% lower cost. Caterpillar's remanufacturing division processed 147 million pounds of returned material in 2023, achieving an 88% core-return rate and underscoring a closed-loop supply chain that resonates with emission-reporting mandates.
Rental fleets exploit the price gap by reserving refurbished units for short-term contracts and deploying new machines on long-duration leases, thereby optimizing asset utilization across customer segments. Although new machines still hold the majority of revenue, lifecycle economics, landfill-disposal fees, and circular-economy legislation in the European Union suggest sustained momentum for rebuilds. Overall, the mobile crushers and screeners market size tied to refurbished sales is likely to rise faster than headline demand.
Mobile screeners logged a 5.81% CAGR outlook, eclipsing crushers' 5.26% trajectory. Vibratory models dominate thanks to low power draw, but high-tonnage gyratory screeners are gaining share in iron-ore and coal circuits where deck blinding limits linear-screen throughput. EU Directive 2018/851 mandates 70% recovery of construction and demolition waste, driving onsite separation workflows that hinge on versatile screening plants.
OEMs are integrating wind sifters and magnetic separators into screen chassis, converting single-purpose machines into multi-fraction processors. Kleemann's 10.5 m2 triple-deck MOBISCREEN MSS 1102 PRO exemplifies the trend, enabling contractors to create recycled concrete aggregate that meets road-base specifications without trans-shipping material. Such innovations underpin the mobile crushers and screeners market's pivot toward value-adding separation rather than pure size reduction.
Complete Report Scope:
- By Type
- New
- Refurbished
- By Machinery Type
- Mobile Crushers
- Jaw Crushers
- Cone Crushers
- Impact Crushers
- Other Mobile Crushers
- Mobile Screeners
- Vibratory Screeners
- Gyratory Screeners
- Other Mobile Screeners
- Mobile Crushers
- By End-User Industry
- Mining and Metallurgy
- Aggregate Processing
- Recycling
- Construction and Infrastructure
- Other End-User Industries
- By Capacity Range
- Up to 200 t/h
- 200-500 t/h
- Above 500 t/h
- By Power Source
- Diesel-Hydraulic
- Hybrid-Electric
- Fully Electric
- By Geography
- North America
- United States
- Canada
- Mexico
- South America
- Brazil
- Argentina
- Rest of South America
- Europe
- Germany
- United Kingdom
- France
- Italy
- Spain
- Russia
- Rest of Europe
- Asia Pacific
- China
- India
- Japan
- South Korea
- Australia and New Zealand
- Rest of Asia Pacific
- Middle East
- Saudi Arabia
- United Arab Emirates
- Turkey
- Rest of Middle East
- Africa
- South Africa
- Egypt
- Nigeria
- Rest of Africa
- North America
Geography Analysis
Asia Pacific anchored 42.11% of 2025 revenue, with China, India, and Indonesia investing heavily in rail, road, and affordable housing. The region benefits from both large-scale quarrying and urban redevelopment, ensuring steady equipment turnover. Australia continues to procure above-500 t/h crushers for iron-ore expansions, while Southeast Asian nations prefer mid-capacity units that can navigate tighter job sites.
Middle East and Africa is expected to post the fastest 5.98% CAGR as lithium and cobalt extraction scales in the Democratic Republic of Congo, Zambia, and Zimbabwe. Mobile plants permit early cash-flow generation ahead of permanent infrastructure completion, and recent upgrades to the Lobito Atlantic Railway further enhance export economics. Funding for hydropower and logistics corridors supports sustained demand for off-grid diesel-hydraulic and hybrid machines.
North America represents the second-largest revenue pool thanks to high rental penetration and an aging interstate network currently under rehabilitation via Infrastructure Investment and Jobs Act allocations. Europe's mature construction sector shows slower aggregate growth, but stringent emission standards accelerate fleet renewal toward hybrid and electric models, underpinning replacement demand within the mobile crushers and screeners market. South America and the Middle East round out global sales, driven by Brazilian mining expansions and Saudi megaprojects respectively.
- Metso Oyj
- Sandvik AB
- Terex Corporation
- Kleemann GmbH
- Komatsu Ltd.
- Astec Industries Inc.
- Keestrack NV
- McCloskey International Limited
- Rubble Master HMH GmbH
- Epiroc AB
- CDE Global Ltd.
- SBM Mineral Processing GmbH
- thyssenkrupp AG
- IROCK Crushers LLC
- Tesab Engineering Ltd.
- Anaconda Equipment International Ltd.
- Eagle Crusher Company Inc.
- Screencore US LLC
- Portafill International Ltd.
- Maximus Crushing and Screening Ltd.
Additional Benefits:
- The market estimate (ME) sheet in Excel format
- 3 months of analyst support
TABLE OF CONTENTS
1 INTRODUCTION
- 1.1 Study Assumptions and Market Definition
- 1.2 Scope of the Study
2 RESEARCH METHODOLOGY
3 EXECUTIVE SUMMARY
4 MARKET LANDSCAPE
- 4.1 Market Overview
- 4.2 Market Drivers
- 4.2.1 Growing Demand for On-Site Crushing to Cut Hauling Costs
- 4.2.2 Expansion of Construction Sector amid Urbanization
- 4.2.3 Rising Mineral Extraction in Emerging Economies
- 4.2.4 Adoption of Hybrid-Electric Mobile Crushers for Emission Compliance
- 4.2.5 Rental Fleet Expansion Driven by Asset-Light Strategies
- 4.2.6 Integration of Telematics Enabling Predictive Maintenance
- 4.2.7 Increase in Micro-Mobility Construction Projects in Remote Terrains
- 4.2.8 Government Stimulus for Circular Economy-Driven Demolition Waste Recycling
- 4.3 Market Restraints
- 4.3.1 High Initial Capital Expenditure
- 4.3.2 Volatility in Raw Material Prices Impacting Equipment Cost
- 4.3.3 Permitting Hurdles for Mobile Plant Deployment in Urban Zones
- 4.3.4 Skilled Operator Shortage Limiting Utilization Rates
- 4.3.5 Battery-Raw-Material Supply Risk for Fully Electric Models
- 4.4 Industry Value-Chain Analysis
- 4.5 Regulatory Landscape
- 4.6 Technological Outlook
- 4.7 Impact of Macroeconomic Factors on the Market
- 4.8 Porter's Five Forces Analysis
- 4.8.1 Bargaining Power of Suppliers
- 4.8.2 Bargaining Power of Buyers
- 4.8.3 Threat of New Entrants
- 4.8.4 Threat of Substitutes
- 4.8.5 Intensity of Competitive Rivalry
5 MARKET SIZE AND GROWTH FORECASTS (VALUE)
- 5.1 By Type
- 5.1.1 New
- 5.1.2 Refurbished
- 5.2 By Machinery Type
- 5.2.1 Mobile Crushers
- 5.2.1.1 Jaw Crushers
- 5.2.1.2 Cone Crushers
- 5.2.1.3 Impact Crushers
- 5.2.1.4 Other Mobile Crushers
- 5.2.2 Mobile Screeners
- 5.2.2.1 Vibratory Screeners
- 5.2.2.2 Gyratory Screeners
- 5.2.2.3 Other Mobile Screeners
- 5.2.1 Mobile Crushers
- 5.3 By End-User Industry
- 5.3.1 Mining and Metallurgy
- 5.3.2 Aggregate Processing
- 5.3.3 Recycling
- 5.3.4 Construction and Infrastructure
- 5.3.5 Other End-User Industries
- 5.4 By Capacity Range
- 5.4.1 Up to 200 t/h
- 5.4.2 200-500 t/h
- 5.4.3 Above 500 t/h
- 5.5 By Power Source
- 5.5.1 Diesel-Hydraulic
- 5.5.2 Hybrid-Electric
- 5.5.3 Fully Electric
- 5.6 By Geography
- 5.6.1 North America
- 5.6.1.1 United States
- 5.6.1.2 Canada
- 5.6.1.3 Mexico
- 5.6.2 South America
- 5.6.2.1 Brazil
- 5.6.2.2 Argentina
- 5.6.2.3 Rest of South America
- 5.6.3 Europe
- 5.6.3.1 Germany
- 5.6.3.2 United Kingdom
- 5.6.3.3 France
- 5.6.3.4 Italy
- 5.6.3.5 Spain
- 5.6.3.6 Russia
- 5.6.3.7 Rest of Europe
- 5.6.4 Asia Pacific
- 5.6.4.1 China
- 5.6.4.2 India
- 5.6.4.3 Japan
- 5.6.4.4 South Korea
- 5.6.4.5 Australia and New Zealand
- 5.6.4.6 Rest of Asia Pacific
- 5.6.5 Middle East
- 5.6.5.1 Saudi Arabia
- 5.6.5.2 United Arab Emirates
- 5.6.5.3 Turkey
- 5.6.5.4 Rest of Middle East
- 5.6.6 Africa
- 5.6.6.1 South Africa
- 5.6.6.2 Egypt
- 5.6.6.3 Nigeria
- 5.6.6.4 Rest of Africa
- 5.6.1 North America
6 COMPETITIVE LANDSCAPE
- 6.1 Market Concentration
- 6.2 Strategic Moves
- 6.3 Market Share Analysis
- 6.4 Company Profiles (includes Global Level Overview, Market Level Overview, Core Segments, Financials as Available, Strategic Information, Market Rank/Share for Key Companies, Products and Services, and Recent Developments)
- 6.4.1 Metso Oyj
- 6.4.2 Sandvik AB
- 6.4.3 Terex Corporation
- 6.4.4 Kleemann GmbH
- 6.4.5 Komatsu Ltd.
- 6.4.6 Astec Industries Inc.
- 6.4.7 Keestrack NV
- 6.4.8 McCloskey International Limited
- 6.4.9 Rubble Master HMH GmbH
- 6.4.10 Epiroc AB
- 6.4.11 CDE Global Ltd.
- 6.4.12 SBM Mineral Processing GmbH
- 6.4.13 thyssenkrupp AG
- 6.4.14 IROCK Crushers LLC
- 6.4.15 Tesab Engineering Ltd.
- 6.4.16 Anaconda Equipment International Ltd.
- 6.4.17 Eagle Crusher Company Inc.
- 6.4.18 Screencore US LLC
- 6.4.19 Portafill International Ltd.
- 6.4.20 Maximus Crushing and Screening Ltd.
7 MARKET OPPORTUNITIES AND FUTURE OUTLOOK
- 7.1 White-Space and Unmet-Need Assessment

