PUBLISHER: Mordor Intelligence | PRODUCT CODE: 2113441

PUBLISHER: Mordor Intelligence | PRODUCT CODE: 2113441
Industrial Robotics - Market Share Analysis, Industry Trends & Statistics, Growth Forecasts (2026 - 2031)
According to Mordor Intelligence, the industrial robotics market size stands at USD 54.28 billion in 2026 and is projected to reach USD 94.38 billion by 2031, advancing at an 11.7% CAGR over the forecast period.
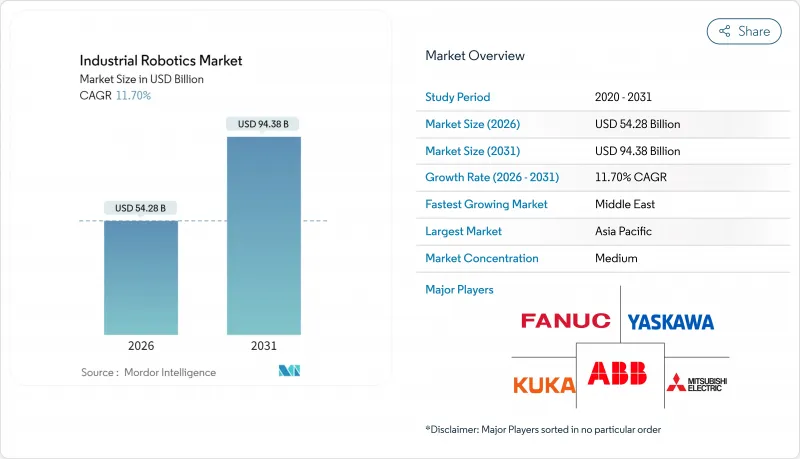
This report is Segmented by Type of Robot (Articulated Robots, Linear Robots, SCARA Robots, Collaborative Robots, and More), Payload Capacity (<=15 Kg, 16-225 Kg, and More), Application (Material Handling and Packaging, and More), End-User Industry (Automotive, Electrical and Electronics, and More), and Geography. The Market Sizes and Forecasts are Provided in Terms of Value (USD).
Global Industrial Robotics Market Trends and Insights
Rising Labor Costs and Ageing Workforce
Manufacturing wage inflation outpaced consumer-price growth by 1.8 percentage points annually between 2020 and 2025 in OECD economies, squeezing margins for labor-intensive assembly and pushing businesses toward quick-payback automation. Japan's working-age population declined by 6.2 million over the same span, so tier-one automotive suppliers installed night-shift collaborative cells to offset hiring gaps. German factories reported 420,000 open skilled-trade positions in 2025, accelerating use of articulated welders that were once cost-prohibitive for mid-size shops. In the United States, a projected 2.1 million manufacturing-worker deficit by 2030 triggered federal tax credits worth 30% of qualified automation spend in designated zones. South Korea doubled subsidies for small manufacturers in 2025, covering half the robot bill when turnover exceeds 40% in key trades.
Rapid Adoption of AI and IIoT-Enabled Smart Factories
Edge processors embedded in robot controllers now execute closed-loop optimizations that lower scrap by up to 18% in automotive paint and pharma coating lines. Digital-twin simulations shorten commissioning by 28 days on average, cutting integration labor nearly one-fifth. Predictive maintenance flags bearing wear 72 hours before failure, slashing unplanned body-shop downtime by 41% at high-utilization plants. The IIC-PUB-G1 guideline standardized OPC UA for robot-to-PLC traffic, finally enabling vendor-agnostic cell orchestration. Machine-vision powered by convolutional neural networks achieved 98.4% accuracy in 2025 electronics inspection, surpassing human inspectors at six-hundred-part-per-minute line speeds.
High Upfront Cap-Ex for SMEs
A full six-axis cell, including guarding and end-of-arm tools, costs USD 180,000-320,000, absorbing up to 70% of annual capital budgets at firms below USD 15 million revenue. Robot-as-a-Service leases cut the entry ticket, yet USD 1,800-3,200 monthly still tops single-shift labor in Mexico, Vietnam, and India. EIB data show 62% of SME automation-loan proposals were denied in 2025 for collateral shortfalls, bottlenecking uptake in Europe. Although accelerated depreciation permits year-one expensing in the United States and Germany, cash-flow limits persist for companies with margins under 15% EBITDA. Cobots priced at USD 35,000-50,000 help, but 10-15 kilogram payloads exclude heavy welding and metal forming.
Other drivers and restraints analyzed in the detailed report include:
- Government Cap-Ex Subsidies for Automation
- Tariff-Driven Reshoring Fuels U.S. Automation Spend
- Scarcity of Robot-Integration Talent
For complete list of drivers and restraints, kindly check the Table Of Contents.
Segment Analysis
Articulated units retained 62.52% industrial robotics market share in 2025, reflecting their versatility across welding, painting, and palletizing. Their dominance holds in automotive and machinery, yet collaborative robots outpace with a 12.92% CAGR through 2031 as factories favor human-friendly cells that redeploy without fencing. Cobot deployments rose in late pick-and-place and small-batch assembly, where quick reprogramming trims changeovers under 20 minutes. Cartesian and gantry machines remain important for oversized aerospace panels and windshield installation, while SCARA and delta variants protect niches in electronics and food sorting through sub-0.4-second cycles. Cylindrical units keep a shrinking foothold in legacy machine tending because articulated models now match reach at similar prices.
ABB's GoFa combines 12-kilogram payloads with 2.2 m/second speed, overlapping mid-reach articulated performance. Yaskawa's HC series embeds vision and force sensors that previously required third-party kits. As ISO/TS 15066 caps contact force, software plays an outsized role, distinguishing vendors that can tune dynamic joint limits for simultaneous safety and throughput. Over the forecast, cobots are expected to infiltrate 35% of green-field cells, especially in electronics final assembly and medical-device kitting where daily product mixes oscillate sharply. Meanwhile, articulated stalwarts continue to rule heavy welding and paint booths due to payload and explosion-proof requirements.
Mid-range 16-225 kilogram machines represented 49.54% of 2025 shipments, owing to ubiquitous automotive body-in-white tasks. Nevertheless, sub-15 kilogram designs log a 13.72% CAGR to 2031, translating miniaturized servo drives into slender arms fit for cramped electronics and pharma lines. Collaborative models dominate this weight class, capturing 68% of units as ISO/TS 15066 permits uncaged operation when forces stay under 150 newtons. Demand accelerates with smartphone and wearable volumes, in which +-0.01 millimeter repeatability is mandatory. The 226-500 kilogram band serves chassis lifting and aerospace tooling; above 500 kilograms, robots remain niche yet indispensable for press tending and wind-blade handling where loads exceed one metric ton.
Electronics assembly generated 58% of lightweight demand in 2025, driven by sub-1-second placement cycles. Pharmaceutical vial handling specifies stainless-steel variants in the 5-10 kilogram range to meet ISO 14644 class 5 clean-room rules. Battery-module lines adopt 50-100 kilogram robots capable of 0.05 millimeter bolt-tightening to avert thermal runaway risks. Food processors prefer delta arms under 3 kilograms for 200-plus picks per minute, leveraging IP65 casings against washdown chemicals. Heavy-duty arms above 500 kilograms are expected to lose share as integrators substitute clusters of synchronized mid-range units that simplify maintenance and spares.
Complete Report Scope:
- By Robot Type
- Articulated Robots
- SCARA Robots
- Cartesian / Gantry Robots
- Parallel / Delta Robots
- Cylindrical Robots
- Collaborative Robots (Cobots)
- By Payload Capacity
- <=15 kg
- 16-225 kg
- 226-500 kg
- Above 500 kg
- By Application
- Material Handling and Packaging
- Welding and Soldering
- Assembly and Dispensing
- Machine Tending and CNC
- Painting and Coating
- Quality Inspection
- By End-User Industry
- Automotive
- Electrical and Electronics
- Food and Beverage
- Machinery and Metal
- Pharmaceuticals and Healthcare
- Construction Materials
- Other End-User Industries
- By Geography
- North America
- United States
- Canada
- Mexico
- South America
- Brazil
- Argentina
- Rest of South America
- Europe
- Germany
- United Kingdom
- France
- Italy
- Russia
- Rest of Europe
- Asia Pacific
- China
- Japan
- South Korea
- India
- Rest of Asia Pacific
- Middle East
- GCC
- Turkey
- Rest of Middle East
- Africa
- South Africa
- Rest of Africa
- North America
Geography Analysis
Asia Pacific generated 44.36% of 2025 revenue, anchored by China's domestic manufacturers capturing 52% of local installations under subsidy schemes that cover up to 40% of robot costs. Japan reached a density of 399 units per 10,000 workers, the world's highest, as automation offsets a shrinking labor base. India's production-linked incentive pays 4-6% rebates tied to productivity lifts, spurring smartphone and appliance plants to add lightweight cobots.
North America delivered 26% of the industrial robotics market in 2025, with United States factories absorbing 78% of regional shipments as CHIPS Act grants and tariff pressures prompt local wafer fabs and EV plants. Mexico's USD 28 billion near-shoring inflow relies on articulated units to satisfy USMCA thresholds while maintaining cost advantages. Canada's Strategic Innovation Fund earmarks CAD 2.1 billion for advanced manufacturing, demanding cobot integration in battery lines.
Europe accounted for 21% of global revenue in 2025, led by Germany, which booked 38% of continental installs helped by Digital Now reimbursement. Italy and France follow, where wage structures keep payback periods under 20 months. Rising cyber-security regulation, notably ISO/IEC 62443 mandates, compels buyers to favor suppliers with hardened controllers, indirectly elevating switching costs.
The Middle East, while only 4% of 2025 value, unlocks the steepest 12.22% CAGR as Saudi Vision 2030 invests USD 3.2 trillion in non-oil capacity and the United Arab Emirates mandates 50% localized output by 2031. Government industrial zones offer zero-interest loans for automation, making robots cost-competitive with migrant labor. South America and Africa jointly held 9% in 2025; adoption remains hampered by financing models that require 40-50% down payments and thin integrator networks. Nonetheless, Chilean lithium and Brazilian agribusiness pilots signal nascent demand for wash-down and heavy-payload variants.
- ABB Ltd.
- FANUC Corporation
- Yaskawa Electric Corp.
- KUKA AG
- Mitsubishi Electric Corp.
- Kawasaki Heavy Industries (Robotics)
- DENSO Corporation
- Omron Corporation
- Panasonic Corp.
- Epson Robots
- Staubli Robotics
- Comau S.p.A.
- Yamaha Robotics
- Universal Robots (Teradyne)
- Nachi-Fujikoshi Corp.
- Techman Robot Inc.
- Siasun Robot and Automation
- Doosan Robotics
- Hanwha Robotics
Additional Benefits:
- The market estimate (ME) sheet in Excel format
- 3 months of analyst support
TABLE OF CONTENTS
1 INTRODUCTION
- 1.1 Study Assumptions and Market Definition
- 1.2 Scope of the Study
2 RESEARCH METHODOLOGY
3 EXECUTIVE SUMMARY
4 MARKET LANDSCAPE
- 4.1 Market Overview
- 4.2 Market Drivers
- 4.2.1 Rising Labor Costs and Ageing Workforce
- 4.2.2 Rapid Adoption of AI and IIoT-Enabled Smart Factories
- 4.2.3 Government Cap-Ex Subsidies for Automation (China, Korea, Germany)
- 4.2.4 Tariff-Driven Reshoring Fuels US Automation Spend
- 4.2.5 ESG Push for Energy-Efficient, Low-Carbon Robots
- 4.2.6 Robot-as-a-Service Boosted by Accelerated Depreciation Rules
- 4.3 Market Restraints
- 4.3.1 High Upfront Cap-Ex for SMEs
- 4.3.2 Scarcity of Robot-Integration Talent
- 4.3.3 Cyber-Security Liabilities in Connected Production Cells
- 4.3.4 Rare-Earth Servo-Motor Supply Volatility
- 4.4 Industry Value Chain Analysis
- 4.5 Regulatory Landscape
- 4.6 Technological Outlook
- 4.7 Impact of Macroeconomic Factors on the Market
- 4.8 Porter's Five Forces Analysis
- 4.8.1 Bargaining Power of Suppliers
- 4.8.2 Bargaining Power of Buyers
- 4.8.3 Threat of New Entrants
- 4.8.4 Threat of Substitutes
- 4.8.5 Intensity of Competitive Rivalry
5 MARKET SIZE AND GROWTH FORECASTS (VALUE)
- 5.1 By Robot Type
- 5.1.1 Articulated Robots
- 5.1.2 SCARA Robots
- 5.1.3 Cartesian / Gantry Robots
- 5.1.4 Parallel / Delta Robots
- 5.1.5 Cylindrical Robots
- 5.1.6 Collaborative Robots (Cobots)
- 5.2 By Payload Capacity
- 5.2.1 <=15 kg
- 5.2.2 16-225 kg
- 5.2.3 226-500 kg
- 5.2.4 Above 500 kg
- 5.3 By Application
- 5.3.1 Material Handling and Packaging
- 5.3.2 Welding and Soldering
- 5.3.3 Assembly and Dispensing
- 5.3.4 Machine Tending and CNC
- 5.3.5 Painting and Coating
- 5.3.6 Quality Inspection
- 5.4 By End-User Industry
- 5.4.1 Automotive
- 5.4.2 Electrical and Electronics
- 5.4.3 Food and Beverage
- 5.4.4 Machinery and Metal
- 5.4.5 Pharmaceuticals and Healthcare
- 5.4.6 Construction Materials
- 5.4.7 Other End-User Industries
- 5.5 By Geography
- 5.5.1 North America
- 5.5.1.1 United States
- 5.5.1.2 Canada
- 5.5.1.3 Mexico
- 5.5.2 South America
- 5.5.2.1 Brazil
- 5.5.2.2 Argentina
- 5.5.2.3 Rest of South America
- 5.5.3 Europe
- 5.5.3.1 Germany
- 5.5.3.2 United Kingdom
- 5.5.3.3 France
- 5.5.3.4 Italy
- 5.5.3.5 Russia
- 5.5.3.6 Rest of Europe
- 5.5.4 Asia Pacific
- 5.5.4.1 China
- 5.5.4.2 Japan
- 5.5.4.3 South Korea
- 5.5.4.4 India
- 5.5.4.5 Rest of Asia Pacific
- 5.5.5 Middle East
- 5.5.5.1 GCC
- 5.5.5.2 Turkey
- 5.5.5.3 Rest of Middle East
- 5.5.6 Africa
- 5.5.6.1 South Africa
- 5.5.6.2 Rest of Africa
- 5.5.1 North America
6 COMPETITIVE LANDSCAPE
- 6.1 Market Concentration
- 6.2 Strategic Moves
- 6.3 Market Share Analysis
- 6.4 Company Profiles (includes Global Level Overview, Market Level Overview, Core Segments, Financials as Available, Strategic Information, Market Rank / Share for Key Companies, Products and Services, and Recent Developments)
- 6.4.1 ABB Ltd.
- 6.4.2 FANUC Corporation
- 6.4.3 Yaskawa Electric Corp.
- 6.4.4 KUKA AG
- 6.4.5 Mitsubishi Electric Corp.
- 6.4.6 Kawasaki Heavy Industries (Robotics)
- 6.4.7 DENSO Corporation
- 6.4.8 Omron Corporation
- 6.4.9 Panasonic Corp.
- 6.4.10 Epson Robots
- 6.4.11 Staubli Robotics
- 6.4.12 Comau S.p.A.
- 6.4.13 Yamaha Robotics
- 6.4.14 Universal Robots (Teradyne)
- 6.4.15 Nachi-Fujikoshi Corp.
- 6.4.16 Techman Robot Inc.
- 6.4.17 Siasun Robot and Automation
- 6.4.18 Doosan Robotics
- 6.4.19 Hanwha Robotics
7 MARKET OPPORTUNITIES AND FUTURE OUTLOOK
- 7.1 White-Space and Unmet-Need Assessment

