PUBLISHER: Mordor Intelligence | PRODUCT CODE: 2114018

PUBLISHER: Mordor Intelligence | PRODUCT CODE: 2114018
Electric Motor - Market Share Analysis, Industry Trends & Statistics, Growth Forecasts (2026 - 2031)
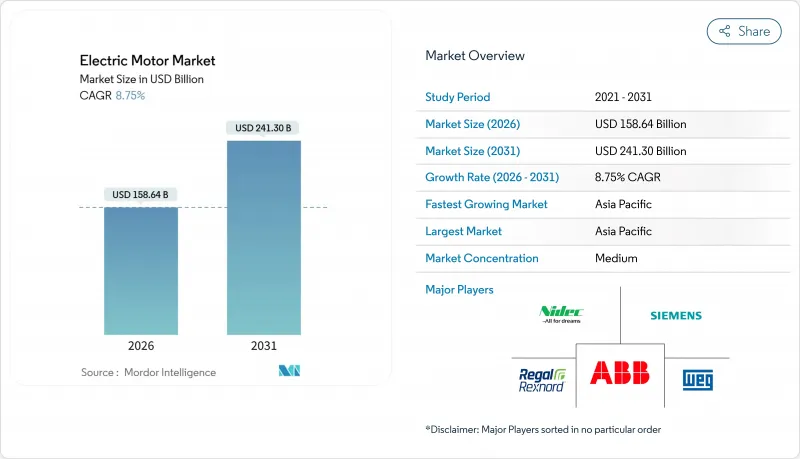
According to Mordor Intelligence, the electric motor market size is estimated at USD 158.64 billion in 2026, and is expected to reach USD 241.30 billion by 2031, at a CAGR of 8.75% during the forecast period (2026-2031).
This report is Segmented by Motor Type (DC Motor, AC Motor, and Others), Output Power Rating (Fractional Horsepower, and More), Voltage (Low Voltage, Medium Voltage, and High Voltage), Application (Industrial Machinery, HVAC and Refrigeration, and More), End-Use Industry (Residential, Commercial, and Industrial), and Geography (North America, Europe, Asia-Pacific, South America, and Middle East and Africa).
Global Electric Motor Market Trends and Insights
Rapid Electrification of Manufacturing Automation in Asia's Discrete Industries
Robot-dense assembly lines across China, Japan, South Korea, and the ASEAN region are embedding four to seven servo axes in each new unit. The International Federation of Robotics counted 542,000 installations worldwide in 2024, more than 70% of which landed in Asia-Pacific. Every joint needs a compact, high-precision motor, raising average motor value per robot and pulling demand toward brushless DC and permanent-magnet synchronous designs with integrated feedback. India's electronics Production-Linked Incentive scheme has allocated USD 1.5 billion in subsidies, spurring local sourcing of motors to qualify for tariff relief. Original-equipment manufacturers now specify duty-cycle-resilient windings and temperature-resistant insulation, shifting procurement criteria from unit price to lifetime throughput.
Accelerating HVAC Adoption in US Residential Retrofits Driven by Federal Energy Standards
The U.S. Department of Energy's updated SEER2 rules, finalized in 2024, effectively require electronically commutated motors in blower assemblies, setting off a replacement surge across millions of homes. Variable-speed ECMs cut electricity use by up to 30% relative to permanent split-capacitor motors, a benefit that utilities in California and Texas monetize through demand-response incentives. Motor vendors are bundling diagnostics and cloud-based warranties, framing the motor as a gateway to service revenue rather than a one-time component sale. Installers initially wary of 40-60% price premiums have shifted stance as federal tax credits shorten payback periods to two heating seasons.
Volatile Neodymium Prices Pressuring Permanent-Magnet Motor Economics
Neodymium oxide prices spiked 15% during 2024 as Chinese supply faced quota adjustments, squeezing manufacturers that commit to fixed-price automotive contracts. Magnets represent up to 30% of a traction motor's bill of materials, so pricing swings erode already-thin margins. Stockpiling inventory locks working capital and risks devaluation, pushing some vendors to investigate induction or switched-reluctance alternatives that sidestep rare-earth dependence at modest efficiency penalties.
Other drivers and restraints analyzed in the detailed report include:
- Surging Offshore Wind Turbine Installations Requiring High-Power Permanent-Magnet Motors in Europe
- Battery Electric Vehicle Powertrain Ramp-Up in China Catalyzing High-Efficiency Traction Motors Demand
- Supply Constraints of IGBT Modules Limiting High-Voltage Motor Production
For complete list of drivers and restraints, kindly check the Table Of Contents.
Segment Analysis
AC machines accounted for 74% of the Electric Motors market revenue in 2025 and are set to grow 9.45% yearly, underpinned by entrenched use in pumps, compressors, and HVAC blowers. Induction models dominate fixed-speed duties, but synchronous variants are picking up share wherever variable-frequency drives unlock precision and energy gains. Adoption of IE4 and IE5 classes in Europe has accelerated synchronous uptake, particularly in frame sizes above 0.75 kilowatts. DC architectures hold ground in automotive, power tools, and small appliances, where torque density and battery compatibility outweigh higher upfront cost. Brushless DC motors now ship inside nearly every premium vacuum cleaner, extending run time per charge by up to 40%.
A rising hybrid class blends induction robustness with permanent-magnet rotors, delivering IE4 efficiency while starting direct-on-line, a feature valued in developing markets that lack ubiquitous inverter infrastructure. Specialty formats, hermetic, stepper, and axial-flux, remain small yet profitable niches tied to refrigeration, 3-D printing, and mobility startups. As performance envelopes overlap, purchasing decisions hinge less on taxonomy and more on application-specific metrics such as acoustic signature, thermal headroom, or torque-per-kilogram.
Motors below 1 horsepower held 51.4% of 2025 shipments, reflecting ubiquity across refrigerators, washing machines, and payment terminals. Price elasticity rules this tranche: a USD 3 cost delta can flip sourcing decisions, yet ENERGY STAR thresholds force incremental efficiency gains year after year. Integral-horsepower machines between 1 and 500 horsepower serve conveyors, compressors, and machine tools where downtime costs dwarf equipment prices. The Electric Motors market size for this middle band continues to expand as factories retrofit IE4 models to capture up to 5% energy savings.
High-power units above 500 horsepower, though smaller in volume, are forecast to grow 7.8% annually to 2031 on the replacement of aging assets in mining and petrochemicals. Operators weigh rewind services that recover only original IE1 or IE2 efficiency against new-build IE4 alternatives with 3- to 4-year paybacks at current energy tariffs. Some OEMs now offer modular stator-rotor cartridges that upgrade legacy frames in situ, bridging the gap between full replacement and refurbishment.
Complete Report Scope:
- By Motor Type
- AC Motor (Induction (Asynchronous), Synchronous)
- DC Motor (Brushed, Brushless (BLDC))
- Others (Hermetic Motor, Stepper Motor)
- By Output Power Rating
- Fractional Horsepower (Below 1 HP)
- Integral Horsepower (1 to 500 HP)
- High-Power (Above 500 HP)
- By Voltage
- Low Voltage (Below 1 kV)
- Medium Voltage (1 to 6 kV)
- High Voltage (Above 6 kV)
- By Application
- Industrial Machinery
- HVAC and Refrigeration
- Automotive and Transportation
- Residential Appliances
- Utilities and Energy
- Others (Agriculture, Oil and Gas, Mining)
- By End-Use Industry
- Residential
- Commercial
- Industrial
- By Geography
- North America
- United States
- Canada
- Mexico
- Europe
- United Kingdom
- Germany
- France
- Spain
- NORDIC Countries
- Russia
- Rest of Europe
- Asia-Pacific
- China
- India
- Japan
- South Korea
- Malaysia
- Thailand
- Indonesia
- Vietnam
- Australia
- Rest of Asia-Pacific
- South America
- Brazil
- Argentina
- Colombia
- Rest of South America
- Middle East and Africa
- United Arab Emirates
- Saudi Arabia
- South Africa
- Egypt
- Rest of Middle East and Africa
- North America
Geography Analysis
Asia-Pacific retained a 43.8% Electric Motors market share in 2025 and is tracking a 10.7% CAGR to 2031. Chinese automakers delivered 14.78 million new-energy vehicles through November 2025, a vector that multiplies traction-motor demand as sedans transition to dual-motor layouts. Robotics installations across the region surpassed 70% of the global 542,000 units in 2024, each cell requiring up to seven precision motors. India's Production-Linked Incentive subsidies channel USD 1.5 billion into electronics and motor production, while Vietnam and Thailand attract appliance assembly lines that localize sourcing and compress lead times.
North American momentum stems from HVAC retrofits mandated by DOE SEER2 standards and industrial predictive-maintenance rollouts. A 2024 survey recorded 38% of replacements triggered by sensor alerts rather than time-based schedules, indicating a data-driven paradigm in asset management. Canada's mining sector is moving to IE4 high-horsepower upgrades to mitigate electricity costs above USD 0.12 per kilowatt-hour in remote zones. Mexico's near-shoring influx for automotive and white goods manufacturing tightens regional supply chains and boosts medium-voltage motor uptake in new production halls.
Europe's landscape is policy-led. Ecodesign regulations require IE4 compliance today and foreshadow IE5 thresholds by 2027. Offshore wind additions of 16.4 gigawatts in 2024 underpin multi-megawatt generator demand, while Germany's process industries adopt variable-frequency drives that shave 20-40% energy use. The United Kingdom's heat-pump push and Nordic reliance on hydropower converge on motors that operate efficiently under variable loads. Eastern European factories benefit from EU cohesion-fund grants to modernize equipment, nudging adoption of premium-efficiency ratings.
South America's mix is commodity-driven: Brazil's agribusiness relies on irrigation and grain-handling motors that survive high heat and dust, whereas Argentina's lithium mines deploy high-horsepower crushers under IE4 specifications to meet investor sustainability covenants. In the Middle East, oil and gas operators demand explosion-proof units with ATEX and IECEx tags, a certification hurdle that stretches supply timelines but locks in premium pricing. Gulf states invest in district-cooling and desalination systems, fueling medium-voltage pump procurement.
- ABB Ltd.
- Siemens AG
- Nidec Corporation
- Regal Rexnord Corporation
- WEG S.A.
- Toshiba Corporation
- Hitachi Ltd.
- Rockwell Automation, Inc.
- AMETEK, Inc.
- Johnson Electric Holdings Ltd.
- TECO Electric & Machinery Co., Ltd.
- Mitsubishi Electric Corporation
- Baldor Electric Company
- Brook Crompton Holdings Ltd.
- Anhui Wannan Electric Machine Co., Ltd.
- Kirloskar Electric Company Ltd.
- Hyosung Heavy Industries
- Danaher Motion (Kollmorgen)
- Yaskawa Electric Corporation
- Fuji Electric Co., Ltd.
- Robert Bosch GmbH
- Schneider Electric SE
- SEW-Eurodrive GmbH & Co. KG
- Emerson Electric Co.
Additional Benefits:
- The market estimate (ME) sheet in Excel format
- 3 months of analyst support
TABLE OF CONTENTS
1 Introduction
- 1.1 Study Assumptions & Market Definition
- 1.2 Scope of the Study
2 Research Methodology
3 Executive Summary
4 Market Landscape
- 4.1 Market Overview
- 4.2 Recent Trends & Developments
- 4.3 Market Drivers
- 4.3.1 Rapid Electrification of Manufacturing Automation in Asia's Discrete Industries
- 4.3.2 Accelerating HVAC Adoption in US Residential Retrofits Driven by Federal Energy Standards
- 4.3.3 Surging Offshore Wind Turbine Installations Requiring High-Power Permanent-Magnet Motors in Europe
- 4.3.4 Battery Electric Vehicle Powertrain Ramp-Up in China Catalyzing High-Efficiency Traction Motors Demand
- 4.3.5 Industrial IoT-Enabled Predictive Maintenance Boosting Replacement of Aging Motors in North America
- 4.3.6 Government Mandates on MEPS Propelling IE4 & IE5 Motor Sales Globally
- 4.4 Market Restraints
- 4.4.1 Volatile Neodymium Prices Pressuring Permanent-Magnet Motor Economics
- 4.4.2 Supply Constraints of IGBT Modules Limiting High-Voltage Motor Production
- 4.4.3 Lengthy Certification Cycles for Explosion-Proof Motors in Middle-East Oil & Gas
- 4.4.4 Growing Adoption of Integrated Servo Drives Reducing Stand-Alone Motor Revenue Opportunities
- 4.5 Supply-Chain Analysis
- 4.6 Regulatory Outlook
- 4.7 Technological Outlook
- 4.8 Porter's Five Forces
- 4.8.1 Bargaining Power of Suppliers
- 4.8.2 Bargaining Power of Buyers
- 4.8.3 Threat of New Entrants
- 4.8.4 Threat of Substitute Products
- 4.8.5 Intensity of Competitive Rivalry
5 Market Size & Growth Forecasts
- 5.1 By Motor Type
- 5.1.1 AC Motor (Induction (Asynchronous), Synchronous)
- 5.1.2 DC Motor (Brushed, Brushless (BLDC))
- 5.1.3 Others (Hermetic Motor, Stepper Motor)
- 5.2 By Output Power Rating
- 5.2.1 Fractional Horsepower (Below 1 HP)
- 5.2.2 Integral Horsepower (1 to 500 HP)
- 5.2.3 High-Power (Above 500 HP)
- 5.3 By Voltage
- 5.3.1 Low Voltage (Below 1 kV)
- 5.3.2 Medium Voltage (1 to 6 kV)
- 5.3.3 High Voltage (Above 6 kV)
- 5.4 By Application
- 5.4.1 Industrial Machinery
- 5.4.2 HVAC and Refrigeration
- 5.4.3 Automotive and Transportation
- 5.4.4 Residential Appliances
- 5.4.5 Utilities and Energy
- 5.4.6 Others (Agriculture, Oil and Gas, Mining)
- 5.5 By End-Use Industry
- 5.5.1 Residential
- 5.5.2 Commercial
- 5.5.3 Industrial
- 5.6 By Geography
- 5.6.1 North America
- 5.6.1.1 United States
- 5.6.1.2 Canada
- 5.6.1.3 Mexico
- 5.6.2 Europe
- 5.6.2.1 United Kingdom
- 5.6.2.2 Germany
- 5.6.2.3 France
- 5.6.2.4 Spain
- 5.6.2.5 NORDIC Countries
- 5.6.2.6 Russia
- 5.6.2.7 Rest of Europe
- 5.6.3 Asia-Pacific
- 5.6.3.1 China
- 5.6.3.2 India
- 5.6.3.3 Japan
- 5.6.3.4 South Korea
- 5.6.3.5 Malaysia
- 5.6.3.6 Thailand
- 5.6.3.7 Indonesia
- 5.6.3.8 Vietnam
- 5.6.3.9 Australia
- 5.6.3.10 Rest of Asia-Pacific
- 5.6.4 South America
- 5.6.4.1 Brazil
- 5.6.4.2 Argentina
- 5.6.4.3 Colombia
- 5.6.4.4 Rest of South America
- 5.6.5 Middle East and Africa
- 5.6.5.1 United Arab Emirates
- 5.6.5.2 Saudi Arabia
- 5.6.5.3 South Africa
- 5.6.5.4 Egypt
- 5.6.5.5 Rest of Middle East and Africa
- 5.6.1 North America
6 Competitive Landscape
- 6.1 Market Concentration
- 6.2 Strategic Moves (M&A, Partnerships, PPAs)
- 6.3 Market Share Analysis (Market Rank/Share for key companies)
- 6.4 Company Profiles (includes Global level Overview, Market level overview, Core Segments, Financials as available, Strategic Information, Products & Services, and Recent Developments)
- 6.4.1 ABB Ltd.
- 6.4.2 Siemens AG
- 6.4.3 Nidec Corporation
- 6.4.4 Regal Rexnord Corporation
- 6.4.5 WEG S.A.
- 6.4.6 Toshiba Corporation
- 6.4.7 Hitachi Ltd.
- 6.4.8 Rockwell Automation, Inc.
- 6.4.9 AMETEK, Inc.
- 6.4.10 Johnson Electric Holdings Ltd.
- 6.4.11 TECO Electric & Machinery Co., Ltd.
- 6.4.12 Mitsubishi Electric Corporation
- 6.4.13 Baldor Electric Company
- 6.4.14 Brook Crompton Holdings Ltd.
- 6.4.15 Anhui Wannan Electric Machine Co., Ltd.
- 6.4.16 Kirloskar Electric Company Ltd.
- 6.4.17 Hyosung Heavy Industries
- 6.4.18 Danaher Motion (Kollmorgen)
- 6.4.19 Yaskawa Electric Corporation
- 6.4.20 Fuji Electric Co., Ltd.
- 6.4.21 Robert Bosch GmbH
- 6.4.22 Schneider Electric SE
- 6.4.23 SEW-Eurodrive GmbH & Co. KG
- 6.4.24 Emerson Electric Co.
7 Market Opportunities & Future Outlook
- 7.1 White-Space & Unmet-Need Assessment

