PUBLISHER: Mordor Intelligence | PRODUCT CODE: 2114055

PUBLISHER: Mordor Intelligence | PRODUCT CODE: 2114055
Enteral Feeding Formulas - Market Share Analysis, Industry Trends & Statistics, Growth Forecasts (2026 - 2031)
According to Mordor Intelligence, the enteral feeding formulas market size is expected to increase from USD 9.22 billion in 2025 to USD 9.69 billion in 2026 and reach USD 12.44 billion by 2031, growing at a CAGR of 5.12% over 2026-2031.
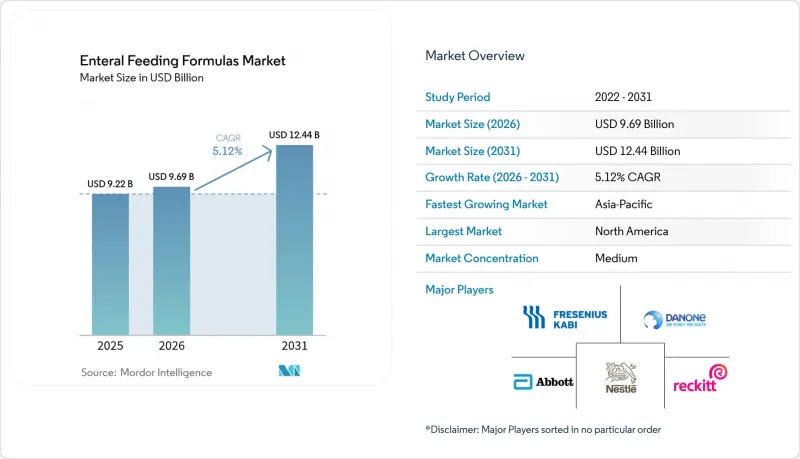
This report is Segmented by Product Type (Standard Polymeric, and More), Caloric Density (Low Energy, and More), End-User (Hospitals, Long-Term Care, Home Enteral Nutrition, and Outpatient Clinics), Age Group (Neonates, Pediatrics, Adults, and Geriatrics), and Geography (North America, Europe, Asia-Pacific, and More). The Market Forecasts are Provided in Terms of Value (USD).
Global Enteral Feeding Formulas Market Trends and Insights
Rising Burden of Chronic and Age-Related Diseases
The global population of people aged 70+ in 2024 was 494.4 million and is expanding steadily as life expectancy rises and fertility falls. Chronic ailments such as stroke, dementia, and cancer frequently impair swallowing or elevate metabolic demands, making long-term enteral feeding essential. Japan illustrates this trend, where citizens aged 65 + represent 29.1% of the population and dysphagia prevalence exceeds 50%. China has more than 280 million people aged 60+, and it is investing in geriatric care centers that routinely prescribe texture-modified formulas. Globally, non-communicable diseases now cause 74% of deaths, reinforcing demand for nutritionally complete formulas that lower complication risks.
Expansion of Home Healthcare Infrastructure
Home enteral nutrition is growing at 8.54% as lightweight pumps and telehealth oversight let caregivers administer feeds safely outside hospitals. U.S. Medicare Part B covers formulas and supplies for permanent feeding-tube users, encouraging earlier discharge. European payers in Germany, France, and the United Kingdom have expanded reimbursement for home care, while Japan's long-term care insurance subsidizes supplies for elders. Clinical trials confirm that home programs lower infection rates and reduce total care costs by about 40% compared with long-term facilities.
Other drivers and restraints analyzed in the detailed report include:
- Cost Advantage of Enteral Versus Parenteral Nutrition
- Technological Advancements in Enteral Pumps and Closed Systems
- Variable Reimbursement and Insurance Coverage Globally
- Clinical Complications Such as Aspiration Pneumonia and GI Intolerance
For complete list of drivers and restraints, kindly check the Table Of Contents.
Segment Analysis
Standard polymeric blends controlled 53.78% of 2025 revenue, reflecting broad clinical familiarity and favorable payment status. Yet the enteral feeding formulas market is shifting as blenderized real-food options post a 7.54% CAGR, propelled by evidence of better bowel regularity and caregiver preference for recognizable ingredients. High-protein lines aimed at oncology and critical-care patients are rising, while peptide-based semi-elemental and elemental amino-acid variants are used for malabsorption or severe allergy cases. Disease-specific innovations, notably diabetes and renal formulas, command premium pricing through validated metabolic benefits. Plant-based entrants such as Kate Farms are winning share by replacing dairy proteins with pea isolates, reinforcing the perception that allergen-light compositions reduce intolerance.
A growing subset of immune-modulating products enriched with arginine and omega-3s is demonstrating 30% fewer postoperative infections, making them attractive despite higher unit costs. These shifts underscore a broader re-orientation of the enteral feeding formulas market toward differentiated formulations that address tolerance, metabolic control, and patient preferences simultaneously.
Isocaloric offerings at 1.0 kcal/ml held 45.42% of segment revenue in 2025, but hypercaloric formats at 1.2-1.5 kcal/ml are tracking a 7.88% CAGR as clinicians seek to meet energy goals in fluid-restricted patients. Very-high-calorie products above 2.0 kcal/ml remain niche due to viscosity challenges that can occlude pumps. Manufacturers are lowering osmolality to curb diarrhea, broadening acceptance. This focus on concentrated nutrition aligns with shorter hospital stays and sicker inpatients who require rapid repletion, reinforcing growth prospects for dense blends in the enteral feeding formulas market.
Complete Report Scope:
- By Product Type
- Standard Polymeric Formulas
- High-Protein Polymeric Formulas
- Peptide-Based / Semi-Elemental Formulas
- Elemental (Amino-Acid) Formulas
- Disease-Specific Formulas
- Immune-Modulating / Synbiotic Formulas
- Blenderized Real-Food Formulas
- By Caloric Density
- Low Energy (<1.0 kcal/ml)
- Isocaloric (≈1.0 kcal/ml)
- Hypercaloric (1.2-1.5 kcal/ml)
- Very-High Calorie (>=2.0 kcal/ml)
- By End-User
- Hospitals & Acute-Care Centres
- Long-Term Care Facilities
- Home Enteral Nutrition (HEN)
- Out-Patient / Ambulatory Clinics
- By Age Group
- Neonates (0-28 Days)
- Pediatrics (1 Month-17 Yrs)
- Adults (18-64 Yrs)
- Geriatrics (>=65 Yrs)
- Geography
- North America
- United States
- Canada
- Mexico
- Europe
- Germany
- United Kingdom
- France
- Italy
- Spain
- Rest of Europe
- Asia-Pacific
- China
- Japan
- India
- Australia
- South Korea
- Rest of Asia-Pacific
- Middle East & Africa
- GCC
- South Africa
- Rest of Middle East & Africa
- South America
- Brazil
- Argentina
- Rest of South America
- North America
Geography Analysis
North America generated 41.86% of global revenue in 2025 thanks to Medicare Part B coverage, advanced home-care networks, and value-based payment models that penalize readmissions. Canada shows province-level variation, whereas Mexico's growth depends on public hospital investment and private insurance uptake.
Asia-Pacific is the fastest-growing region, with a 6.43% CAGR. Japan's super-aged society and national long-term care insurance drive sustained demand for nutrient-dense formulas. China's Healthy China 2030 roadmap is expanding medical-nutrition offerings across tertiary and community facilities. India's urban private hospitals are early adopters, but high out-of-pocket costs still curb rural penetration.
Europe benefits from comprehensive national health systems that reimburse hospital and home feeds. Germany negotiates rates via sickness funds, France covers 100% for chronic disease, and the United Kingdom uses formularies that increasingly favor cost-effective blends. Southern European countries are broadening home support programs to relieve inpatient pressure.
- Abbott Laboratories
- Ajinomoto Co., Inc.
- B. Braun
- Baxter
- Cambrooke Therapeutics Inc.
- Danone
- DSM-Firmenich
- EA Pharma Co., Ltd.
- Fresenius
- Hormel Foods
- Kate Farms, Inc.
- Meiji Holdings Co., Ltd.
- Nestle S.A.
- Nutritional Medicinals LLC
- Otsuka
- Real Food Blends LLC
- Reckitt Benckiser Group
- Victus
- Yakult Honsha Co., Ltd.
Additional Benefits:
- The market estimate (ME) sheet in Excel format
- 3 months of analyst support
TABLE OF CONTENTS
1 Introduction
- 1.1 Study Assumptions & Market Definition
- 1.2 Scope of the Study
2 Research Methodology
3 Executive Summary
4 Market Landscape
- 4.1 Market Overview
- 4.2 Market Drivers
- 4.2.1 Rising Burden of Chronic and Age-Related Diseases
- 4.2.2 Cost Advantage of Enteral Versus Parenteral Nutrition
- 4.2.3 Expansion of Home Healthcare Infrastructure
- 4.2.4 Technological Advancements in Enteral Pumps and Closed Systems
- 4.2.5 Product Innovation in Disease-Specific and High-Protein Formulas
- 4.2.6 Adoption of Value-Based Care and Outcome-Linked Reimbursement Models
- 4.3 Market Restraints
- 4.3.1 Variable Reimbursement and Insurance Coverage Globally
- 4.3.2 Clinical Complications such as Aspiration Pneumonia and GI Intolerance
- 4.3.3 Supply Chain Volatility for Medical-Grade Macronutrient Inputs
- 4.3.4 Limited Clinical Evidence for Emerging Plant-Based and Blenderized Formulas
- 4.4 Value / Supply-Chain Analysis
- 4.5 Regulatory Landscape
- 4.6 Technological Outlook
- 4.7 Porter's Five Forces Analysis
- 4.7.1 Threat Of New Entrants
- 4.7.2 Bargaining Power Of Buyers
- 4.7.3 Bargaining Power Of Suppliers
- 4.7.4 Threat Of Substitutes
- 4.7.5 Industry Rivalry
5 Market Size & Growth Forecasts (Value, USD)
- 5.1 By Product Type
- 5.1.1 Standard Polymeric Formulas
- 5.1.2 High-Protein Polymeric Formulas
- 5.1.3 Peptide-Based / Semi-Elemental Formulas
- 5.1.4 Elemental (Amino-Acid) Formulas
- 5.1.5 Disease-Specific Formulas
- 5.1.6 Immune-Modulating / Synbiotic Formulas
- 5.1.7 Blenderized Real-Food Formulas
- 5.2 By Caloric Density
- 5.2.1 Low Energy (<1.0 kcal/ml)
- 5.2.2 Isocaloric (≈1.0 kcal/ml)
- 5.2.3 Hypercaloric (1.2-1.5 kcal/ml)
- 5.2.4 Very-High Calorie (>=2.0 kcal/ml)
- 5.3 By End-User
- 5.3.1 Hospitals & Acute-Care Centres
- 5.3.2 Long-Term Care Facilities
- 5.3.3 Home Enteral Nutrition (HEN)
- 5.3.4 Out-Patient / Ambulatory Clinics
- 5.4 By Age Group
- 5.4.1 Neonates (0-28 Days)
- 5.4.2 Pediatrics (1 Month-17 Yrs)
- 5.4.3 Adults (18-64 Yrs)
- 5.4.4 Geriatrics (>=65 Yrs)
- 5.5 Geography
- 5.5.1 North America
- 5.5.1.1 United States
- 5.5.1.2 Canada
- 5.5.1.3 Mexico
- 5.5.2 Europe
- 5.5.2.1 Germany
- 5.5.2.2 United Kingdom
- 5.5.2.3 France
- 5.5.2.4 Italy
- 5.5.2.5 Spain
- 5.5.2.6 Rest of Europe
- 5.5.3 Asia-Pacific
- 5.5.3.1 China
- 5.5.3.2 Japan
- 5.5.3.3 India
- 5.5.3.4 Australia
- 5.5.3.5 South Korea
- 5.5.3.6 Rest of Asia-Pacific
- 5.5.4 Middle East & Africa
- 5.5.4.1 GCC
- 5.5.4.2 South Africa
- 5.5.4.3 Rest of Middle East & Africa
- 5.5.5 South America
- 5.5.5.1 Brazil
- 5.5.5.2 Argentina
- 5.5.5.3 Rest of South America
- 5.5.1 North America
6 Competitive Landscape
- 6.1 Market Concentration
- 6.2 Market Share Analysis
- 6.3 Company Profiles (Includes Global-Level Overview, Market-Level Overview, Core Segments, Financials As Available, Strategic Information, Market Rank/Share For Key Companies, Products & Services, And Recent Developments)
- 6.3.1 Abbott Laboratories
- 6.3.2 Ajinomoto Co., Inc.
- 6.3.3 B. Braun SE
- 6.3.4 Baxter International Inc.
- 6.3.5 Cambrooke Therapeutics Inc.
- 6.3.6 Danone S.A.
- 6.3.7 DSM-Firmenich
- 6.3.8 EA Pharma Co., Ltd.
- 6.3.9 Fresenius SE & Co. KGaA
- 6.3.10 Hormel Foods Corporation
- 6.3.11 Kate Farms, Inc.
- 6.3.12 Meiji Holdings Co., Ltd.
- 6.3.13 Nestle S.A.
- 6.3.14 Nutritional Medicinals LLC
- 6.3.15 Otsuka Pharmaceutical Co., Ltd.
- 6.3.16 Real Food Blends LLC
- 6.3.17 Reckitt Benckiser Group plc. (Mead Johnson)
- 6.3.18 Victus, Inc.
- 6.3.19 Yakult Honsha Co., Ltd.
7 Market Opportunities & Future Outlook
- 7.1 White-Space & Unmet-Need Assessment

