PUBLISHER: Mordor Intelligence | PRODUCT CODE: 2114135

PUBLISHER: Mordor Intelligence | PRODUCT CODE: 2114135
Smart Lighting - Market Share Analysis, Industry Trends & Statistics, Growth Forecasts (2026 - 2031)
According to Mordor Intelligence, the smart lighting market size reached USD 27.52 billion in 2026 and is projected to climb to USD 67.83 billion by 2031, translating into a 19.77% CAGR across the forecast horizon, a trajectory that underlines the sector's transition from early-adopter novelty to mainstream building-performance technology.
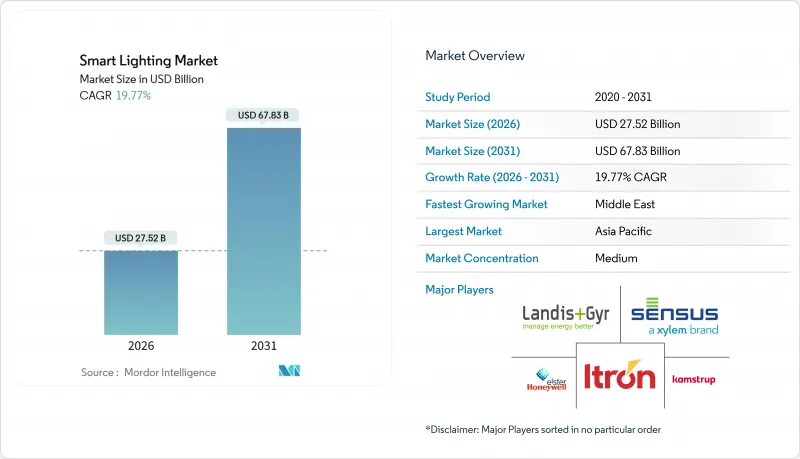
This report is Segmented by Product Type (Control Systems, and Smart Lamps and Fixtures), Installation Type (New Construction, and Retrofit), Connectivity Technology (Bluetooth, Zigbee, and More), End-User (Residential, Commercial, Industrial, and More), and Geography (North America, Europe, Asia-Pacific, Middle East and Africa, and South America). The Market Forecasts are Provided in Terms of Value (USD).
Global Smart Lighting Market Trends and Insights
Expanding Smart-Home Ecosystem Integration
Voice-assistant platforms and Matter 1.4 certification have reduced purchase friction by enabling a single firmware image to interoperate with Apple HomeKit, Google Home, Amazon Alexa, and Samsung SmartThings, removing vendor lock-in and lowering support costs. Thread 1.4's low-power mesh has raised the device limit to 250 nodes per network, while self-healing routes alleviate reliability complaints that dogged early Zigbee rollouts. Smart-bulb average selling prices fell 22% between 2024 and 2025 as Asian contract manufacturers scaled production, expanding the addressable household base. Retrofit-oriented business models benefit disproportionately because consumers can swap bulbs without rewiring. Commercially, hospitality chains now bundle Matter-certified downlights with occupancy sensors so guestrooms automatically adjust to preferred scenes at check-in, improving the guest experience while shaving energy bills.
Rapid LED Cost Reductions Improve ROI
High-bay fixtures suitable for warehouses now retail at USD 120-180, down from USD 250-350 just three years earlier, while efficacy leapt to 150 lumens per watt, nearly double that of metal-halide incumbents. Utility incentives in Massachusetts and Connecticut shave 40-50% off material costs, routinely compressing payback to 12 months. Chinese and South Korean chip foundries are pushing gallium nitride epitaxy yields higher, cutting die costs by a further 10-15% each year. Cities are capitalizing: Dubai retrofitted 900 luminaires on Sheikh Rashid Street in 2024, netting 60% energy savings and a 4-year payback, even without subsidies. The cost curve keeps steepening, reinforcing price elasticity across commercial, industrial, and municipal segments.
Cyber-Security Vulnerabilities in Wireless Protocols
The National Institute of Standards and Technology warned in 2024 that Zigbee and Bluetooth LE lack robust authentication, exposing networks to spoofing when default credentials persist. CVE-2024-41126 demonstrated remote takeover of luminaires via unauthorized pairing, spurring critical-facility operators to air-gap lighting networks or revert to wired DALI-2 buses. Such precautions add USD 8-15 per fixture, lengthening payback and complicating building-automation integration. Matter's device-attestation aims to neutralize the threat by cryptographically verifying hardware provenance, but full mitigation requires field replacements over several product cycles.
Other drivers and restraints analyzed in the detailed report include:
- Utility-Funded Demand-Side-Management Incentives
- National Net-Zero Building Codes
- Fragmented Inter-Operability Standards
For complete list of drivers and restraints, kindly check the Table Of Contents.
Segment Analysis
Smart lamps and fixtures captured 54.67% of the smart lighting market share in 2025, while control systems are set to register the fastest 20.19% CAGR through 2031. Energy-service companies increasingly position controls as the gateway to demand-response revenue, predictive maintenance, and occupant-centric comfort. In value terms, lamps and fixtures still dominated 2025 sales, but commoditization is squeezing margins below 25%. Helvar's ActiveAhead deployment at Volvo Trucks' Swedish plant illustrates the control-centric thesis: edge AI learned work-cell occupancy, pre-dimmed aisles, and harvested daylight to trim an additional 23% of power. Residential buyers, meanwhile, gravitate toward bulbs that require no wiring changes; average retail pricing for a Matter-certified lamp fell to USD 12 in 2025, democratizing access. The shifting stack means firmware, analytics, and cloud dashboards, not raw lumens, determine vendor differentiation.
Smart lamps and fixtures, nonetheless, remain indispensable. Circadian-tuning is gaining traction in offices and hospitality as facility managers quantify productivity gains tied to light spectra, while decorative luminaires support branded ambience in retail. Yet even here, controls are subsuming the narrative: tunable fixtures ship with embedded drivers that listen for Matter or DALI-2 commands out of the box. As the installed base saturates, software upgrades will extract recurring revenue, transforming lamps from capital goods into digital platforms.
Retrofits accounted for 62.91% of the smart lighting market share in 2025, reflecting the significant inventory of fluorescent and metal-halide luminaires still in use in global building stock. Utility incentives underwrite much of the swap-out cost, translating into 12- to 18-month paybacks that meet even CFO-level hurdle rates. Yet the compliance tide is turning: new construction is accelerating at a 20.13% CAGR because updated energy codes make networked lighting mandatory at the blueprint stage. When lighting is specified early, contractors prewire for sensors and provide low-voltage power for gateways, slashing future labor costs.
Retrofit economics bifurcate. Simple lamp-for-lamp replacements yield 50-60% energy cuts but miss the incremental 20-30% available from occupancy-aware dimming. Building owners now select integrated control packages to unlock utility performance-based incentives. Municipal case studies reinforce the point: Dubai's 2024 Sheikh Rashid Street project realized 60% savings on a four-year unsubsidized payback and immediately initiated trials on secondary roads for adaptive dimming.
Complete Report Scope:
- By Product Type
- Control Systems
- Smart Lamps and Fixtures
- By Installation Type
- New Construction
- Retrofit
- By Connectivity Technology
- Wi-Fi
- Bluetooth
- Zigbee
- Other Connectivity Technologies
- By End-User
- Residential
- Commercial
- Industrial
- Other End-Users
- By Geography
- North America
- United States
- Canada
- Mexico
- Europe
- Germany
- United Kingdom
- France
- Russia
- Rest of Europe
- Asia-Pacific
- China
- Japan
- India
- South Korea
- Australia
- Rest of Asia-Pacific
- Middle East and Africa
- Middle East
- Saudi Arabia
- United Arab Emirates
- Rest of Middle East
- Africa
- South Africa
- Egypt
- Rest of Africa
- Middle East
- South America
- Brazil
- Argentina
- Rest of South America
- North America
Geography Analysis
L37: Asia-Pacific commanded 37.38% of the smart lighting market share in 2025, anchored by China's manufacturing scale, India's urbanization, and Japan's tech-savvy construction sector. The region's growth is steady but moderating as early adopters transition from fixture swaps to incremental control-system upgrades. Middle East and Africa, conversely, will post the quickest 20.71% CAGR because sovereign smart-city mandates hard-code LED conversion deadlines as early as 2027. Qatar's Public Works Authority committed to nationwide smart LED streetlighting in October 2025, aiming for 40-50% energy savings.
North America and Europe remain crucibles of innovation. California's 2025 Title 24 revision and Massachusetts' generous DSM rebates shorten payback cycles, embedding lighting controls during schematic design. The European Union's near-zero-energy directive requires member states to incorporate networked lighting in all new buildings by 2028. These policies keep the regions' aggregate revenue base resilient despite lower headline growth.
South America and Africa still lag in penetration due to budget constraints and electricity tariff subsidies that dilute ROI. Brazil and South Africa are piloting municipal conversions, but fiscal austerity limits scale. As LED module pricing falls below USD 1 per kilolumen in 2026, these markets will gradually migrate from pilot to portfolio execution.
- Signify N.V.
- Acuity Brands Inc.
- Hubbell Inc.
- Eaton Corp.
- Lutron Electronics Co. Inc.
- Legrand SA
- Cree Lighting USA, LLC
- Samsung Electronics Co. Ltd.
- Xiaomi Corp.
- Snap One LLC
- Savant Systems Inc.
- Nanoleaf Canada Ltd.
- Sengled Optoelectronics Co.
- Wyze Labs Inc.
- Feit Electric Company, Inc.
- Panasonic Corp.
- Opple Lighting
- EGLO Leuchten GmbH
- Zumtobel Group
Additional Benefits:
- The market estimate (ME) sheet in Excel format
- 3 months of analyst support
TABLE OF CONTENTS
1 INTRODUCTION
- 1.1 Study Assumptions and Market Definition
- 1.2 Scope of the Study
2 RESEARCH METHODOLOGY
3 EXECUTIVE SUMMARY
4 MARKET LANDSCAPE
- 4.1 Market Overview
- 4.2 Market Drivers
- 4.2.1 Expanding Smart-Home Ecosystem Integration
- 4.2.2 Rapid LED Cost Reductions Improve ROI
- 4.2.3 Utility-Funded Demand-Side-Management Incentives
- 4.2.4 National Net-Zero Building Codes (2025-2030 Roll-outs)
- 4.2.5 Li-Fi-Enabled Lighting Pilots in Warehouses
- 4.2.6 Edge-AI-Powered Adaptive Dimming Algorithms
- 4.3 Market Restraints
- 4.3.1 Cyber-Security Vulnerabilities in Wireless Protocols
- 4.3.2 Fragmented Inter-Operability Standards
- 4.3.3 Supply Chain Volatility in Rare-Earth Phosphors
- 4.3.4 Smart-Home Privacy Regulation Uncertainty
- 4.4 Industry Value Chain Analysis
- 4.5 Regulatory Landscape
- 4.6 Technological Outlook
- 4.7 Porter's Five Forces Analysis
- 4.7.1 Bargaining Power of Suppliers
- 4.7.2 Bargaining Power of Buyers
- 4.7.3 Threat of New Entrants
- 4.7.4 Threat of Substitutes
- 4.7.5 Degree of Competition
- 4.8 Impact of Macroeconomic Factors on the Market
5 MARKET SIZE AND GROWTH FORECASTS (VALUE)
- 5.1 By Product Type
- 5.1.1 Control Systems
- 5.1.2 Smart Lamps and Fixtures
- 5.2 By Installation Type
- 5.2.1 New Construction
- 5.2.2 Retrofit
- 5.3 By Connectivity Technology
- 5.3.1 Wi-Fi
- 5.3.2 Bluetooth
- 5.3.3 Zigbee
- 5.3.4 Other Connectivity Technologies
- 5.4 By End-User
- 5.4.1 Residential
- 5.4.2 Commercial
- 5.4.3 Industrial
- 5.4.4 Other End-Users
- 5.5 By Geography
- 5.5.1 North America
- 5.5.1.1 United States
- 5.5.1.2 Canada
- 5.5.1.3 Mexico
- 5.5.2 Europe
- 5.5.2.1 Germany
- 5.5.2.2 United Kingdom
- 5.5.2.3 France
- 5.5.2.4 Russia
- 5.5.2.5 Rest of Europe
- 5.5.3 Asia-Pacific
- 5.5.3.1 China
- 5.5.3.2 Japan
- 5.5.3.3 India
- 5.5.3.4 South Korea
- 5.5.3.5 Australia
- 5.5.3.6 Rest of Asia-Pacific
- 5.5.4 Middle East and Africa
- 5.5.4.1 Middle East
- 5.5.4.1.1 Saudi Arabia
- 5.5.4.1.2 United Arab Emirates
- 5.5.4.1.3 Rest of Middle East
- 5.5.4.2 Africa
- 5.5.4.2.1 South Africa
- 5.5.4.2.2 Egypt
- 5.5.4.2.3 Rest of Africa
- 5.5.4.1 Middle East
- 5.5.5 South America
- 5.5.5.1 Brazil
- 5.5.5.2 Argentina
- 5.5.5.3 Rest of South America
- 5.5.1 North America
6 COMPETITIVE LANDSCAPE
- 6.1 Market Concentration
- 6.2 Strategic Moves
- 6.3 Market Share Analysis
- 6.4 Company Profiles (includes Global Level Overview, Market Level Overview, Core Segments, Financials as Available, Strategic Information, Market Rank/Share for Key Companies, Products and Services, and Recent Developments)
- 6.4.1 Signify N.V.
- 6.4.2 Acuity Brands Inc.
- 6.4.3 Hubbell Inc.
- 6.4.4 Eaton Corp.
- 6.4.5 Lutron Electronics Co. Inc.
- 6.4.6 Legrand SA
- 6.4.7 Cree Lighting USA, LLC
- 6.4.8 Samsung Electronics Co. Ltd.
- 6.4.9 Xiaomi Corp.
- 6.4.10 Snap One LLC
- 6.4.11 Savant Systems Inc.
- 6.4.12 Nanoleaf Canada Ltd.
- 6.4.13 Sengled Optoelectronics Co.
- 6.4.14 Wyze Labs Inc.
- 6.4.15 Feit Electric Company, Inc.
- 6.4.16 Panasonic Corp.
- 6.4.17 Opple Lighting
- 6.4.18 EGLO Leuchten GmbH
- 6.4.19 Zumtobel Group
7 MARKET OPPORTUNITIES AND FUTURE OUTLOOK
- 7.1 White-Space and Unmet-Need Assessment

