PUBLISHER: Mordor Intelligence | PRODUCT CODE: 2114366

PUBLISHER: Mordor Intelligence | PRODUCT CODE: 2114366
High Power Charger For Electric Vehicle - Market Share Analysis, Industry Trends & Statistics, Growth Forecasts (2026 - 2031)
According to Mordor Intelligence, the high power charger for the electric vehicle market size is expected to grow from USD 4.09 billion in 2025 to USD 4.93 billion in 2026 and is forecast to reach USD 12.57 billion by 2031 at 20.58% CAGR over 2026-2031.
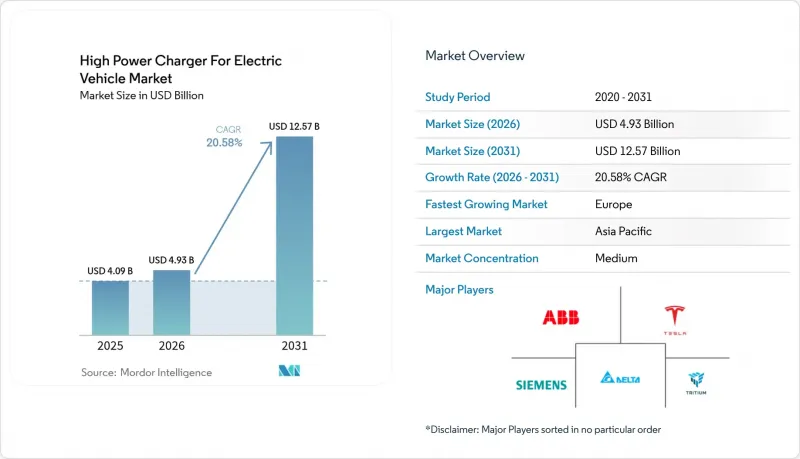
This report is Segmented by Charger Type (DC Fast Chargers, Ultra-Fast Chargers, and More), Power Output (50-150 KW, 150-350 KW, and More), Connector Type (Combined Charging System (CCS), Chademo, and More), Installation Site (Highway Charging Stations, Urban Public Stations, and More), Vehicle Type, End User, and Geography. Market Forecasts are Provided in Terms of Value (USD).
Global High Power Charger For Electric Vehicle Market Trends and Insights
Rapid Expansion of Long-Range EV Sales
In recent years, long-range battery-electric cars with a usable capacity exceeding 80 kWh have gained significant traction in global plug-in sales. Consequently, operators are opting for hardware exceeding 150 kW. This choice stems from the fact that higher-capacity battery packs can be charged much faster with high-powered chargers compared to lower-powered ones. Due to real-world tapering beyond the halfway point of the state of charge, planners are compelled to account for worst-case dwell times instead of relying solely on nameplate power. Highways lacking robust grid capacity necessitate either battery buffers or enhanced feeders, a requirement that can significantly delay projects. This has led to a divided scenario: city drivers often depend on slower urban chargers, while those traveling between cities opt for the convenience of faster charging, albeit at a premium rate.
Government Funding for Ultra-Fast Public Charging
The United States National Electric Vehicle Infrastructure (NEVI) program committed USD 5 billion through 2026 to install charging units capable of offering a minimum of 150 kW of power Europe's AFIR mandates charging stations at regular intervals on key TEN-T roads, with plans to enhance their capacity over time. China's county-level initiative focuses on significantly increasing the number of public fast chargers, supported by land and grid-fee incentives. While grants mitigate capital risks, they come with uptime clauses, nudging hardware vendors to incorporate predictive maintenance.
High CAPEX and Grid-Upgrade Costs
Investors face challenges as the cost of a single unit, combined with necessary transformer upgrades, significantly increases project expenses, particularly in rural areas. In congested grids, interconnection timelines are lengthy, and only well-funded affiliates of major oil companies can independently finance rollouts across multiple sites. Although stationary battery buffers help reduce peak energy demand, they introduce additional capital and maintenance requirements.
Other drivers and restraints analyzed in the detailed report include:
- OEM Shift to 800 V Architectures (Above 350 kW)
- Declining LCOE from Renewables Lowers OPEX
- Standards and Payment-System Fragmentation
For complete list of drivers and restraints, kindly check the Table Of Contents.
Segment Analysis
Ultra-fast dispensers above 250 kW are rising with a 22.35% CAGR through 2031, while DC fast units account for 68.55% of 2025 deployments. Daily utilization for ultra-fast hubs runs 25-35%, surpassing 12-18% for 50-150 kW sites. Wireless pads account for a nominal share but signal emergent demand in premium fleets, whereas pantograph systems sustain significant usage in bus depots.
Despite facing heightened demand charges, the high-power charger market enjoys a 4.5-year payback period at premium highway plazas, making it a financially viable option for operators in these locations. Wireless charging options, while offering the benefit of cable-free convenience, remain limited to niche applications due to their high pad installation costs, which deter widespread adoption. Furthermore, unresolved pantograph interoperability issues continue to pose challenges, forcing many transit agencies to rely on a single vendor, thereby limiting flexibility and increasing dependency on specific suppliers.
50-to-150 kW cabinets retain dominance with 45.60% share in urban areas where grid headroom is tight. Yet profitability depends on ancillary revenue such as digital advertising or demand-response payments. Modular 150-to-250 kW units, favored at suburban shopping centers, can later scale up to 400 kW by adding power modules, reducing stranded-asset risk. The >350 kW band will grow at a 22.10% CAGR, propelled by logistics firms electrifying Class 8 trucks. Operators are bypassing legacy equipment, opting instead for advanced hubs. These hubs, priced competitively, benefit from battery buffers that reduce the need for utility upgrades.
The 150-to-350 kW tier captures a notable share of installations, balancing cost and compatibility with both 400 V and 800 V vehicles. Battery buffers, which represent a considerable investment per site, are becoming standard for installations above 350 kW. Meanwhile, megawatt charging is expected to achieve standardization in the near future. Retailers, cautious about over-investing before a full migration to higher voltages, are using middle-tier chargers as a strategic hedge. This approach allows operators to phase their capital investments, ensuring they remain competitive in the high-power charger market.
Complete Report Scope:
- By Charger Type
- DC Fast Chargers
- Ultra-Fast Chargers (Above 250 kW)
- Wireless Chargers
- Pantograph Chargers
- By Power Output
- 50-150 kW
- 150-350 kW
- Above 350 kW
- By Connector Type
- Combined Charging System (CCS)
- CHAdeMO
- Tesla Supercharger
- GB/T
- Type 2
- By Installation Site
- Highway Charging Stations
- Urban Public Stations
- Fleet Depots
- Commercial Buildings
- Residential Complexes
- By Vehicle Type
- Passenger EVs
- Commercial EVs (Buses, Trucks)
- Two-Wheelers
- Specialty Vehicles
- By End User
- Public Charging Operators
- Private Fleet Owners
- Government Agencies
- Residential Users
- By Geography
- North America
- United States
- Canada
- Rest of North America
- South America
- Brazil
- Argentina
- Rest of South America
- Europe
- Germany
- United Kingdom
- France
- Italy
- Spain
- Rest of Europe
- Asia-Pacific
- China
- India
- Japan
- South Korea
- Rest of Asia-Pacific
- Middle East and Africa
- United Arab Emirates
- Saudi Arabia
- South Africa
- Turkey
- Rest of the Middle East and Africa
- North America
Geography Analysis
Asia-Pacific delivered 48.60% of 2025 revenue as China mandates high power charging and stretches buildout to county-level cities despite lower utilization. Europe leads growth at 22.80% CAGR through 2031, driven by AFIR corridor rules that require 300 kW coverage every 60 km by 2027 . India's FAME-II injected INR 10,000 crore (~USD 1.2 billion) but faces tier-2 grid bottlenecks, delaying projects up to several months. Japan juggles CHAdeMO and CCS dual-standard hardware amid tight urban real estate.
North America holds a notable share of global revenue, anchored by the NEVI program. Canada prioritizes rural and Indigenous communities through its ZEVIP scheme. South America is nascent, with Brazil offering tax offsets but few direct grants, while Argentina's macro-economic volatility tempers investor interest. The Middle East records early momentum, with the United Arab Emirates targeting 1,000 fast chargers by 2030 and Saudi Arabia allocating significant investment as part of Vision 2030.
Turkey waives grid-connection fees, yet high import dependence clouds long-term cost. South Africa installs pilot highway units but grapples with load-shedding, necessitating on-site storage or diesel backup. Across regions, renewable PPAs and battery buffers mitigate grid constraints and stabilize site economics for the high-power charger market.
- ABB Ltd
- Siemens AG
- Tesla, Inc.
- Schneider Electric SE
- ChargePoint Holdings, Inc.
- Delta Electronics, Inc.
- Tritium Charging
- EVBox
- Efacec
- Heliox Energy
- Alpitronic
- Kempower
- Phihong
- Blink Charging Co.
- Star Charge
- Huawei Digital Power Technologies Co., Ltd.
- BYD Company Limted
- Zeekr Power
Additional Benefits:
- The market estimate (ME) sheet in Excel format
- 3 months of analyst support
TABLE OF CONTENTS
1 Introduction
- 1.1 Study Assumptions & Market Definition
- 1.2 Scope of the Study
2 Research Methodology
3 Executive Summary
4 Market Landscape
- 4.1 Market Overview
- 4.2 Market Drivers
- 4.2.1 Rapid Expansion of Long-Range EV Sales
- 4.2.2 Government Funding for Ultra-Fast Public Charging
- 4.2.3 OEM Shift to 800 V Architectures (Above 350 kW)
- 4.2.4 Declining LCOE from Renewables Lowers OPEX
- 4.2.5 Depot Battery-Swap Convergence Needs Pantographs
- 4.2.6 Real-Estate Monetization (Ads and Grid Services) Boosts ROI
- 4.3 Market Restraints
- 4.3.1 High CAPEX and Grid-Upgrade Costs
- 4.3.2 Standards and Payment-System Fragmentation
- 4.3.3 Local Grid Demand-Charge Exposure
- 4.3.4 Battery-Thermal Limits at Above 3 C Charge Rates
- 4.4 Value / Supply-Chain Analysis
- 4.5 Regulatory Landscape
- 4.6 Technological Outlook
- 4.7 Porter's Five Forces
- 4.7.1 Threat of New Entrants
- 4.7.2 Bargaining Power of Suppliers
- 4.7.3 Bargaining Power of Buyers
- 4.7.4 Threat of Substitutes
- 4.7.5 Industry Rivalry
5 Market Size & Growth Forecasts (Value, USD)
- 5.1 By Charger Type
- 5.1.1 DC Fast Chargers
- 5.1.2 Ultra-Fast Chargers (Above 250 kW)
- 5.1.3 Wireless Chargers
- 5.1.4 Pantograph Chargers
- 5.2 By Power Output
- 5.2.1 50-150 kW
- 5.2.2 150-350 kW
- 5.2.3 Above 350 kW
- 5.3 By Connector Type
- 5.3.1 Combined Charging System (CCS)
- 5.3.2 CHAdeMO
- 5.3.3 Tesla Supercharger
- 5.3.4 GB/T
- 5.3.5 Type 2
- 5.4 By Installation Site
- 5.4.1 Highway Charging Stations
- 5.4.2 Urban Public Stations
- 5.4.3 Fleet Depots
- 5.4.4 Commercial Buildings
- 5.4.5 Residential Complexes
- 5.5 By Vehicle Type
- 5.5.1 Passenger EVs
- 5.5.2 Commercial EVs (Buses, Trucks)
- 5.5.3 Two-Wheelers
- 5.5.4 Specialty Vehicles
- 5.6 By End User
- 5.6.1 Public Charging Operators
- 5.6.2 Private Fleet Owners
- 5.6.3 Government Agencies
- 5.6.4 Residential Users
- 5.7 By Geography
- 5.7.1 North America
- 5.7.1.1 United States
- 5.7.1.2 Canada
- 5.7.1.3 Rest of North America
- 5.7.2 South America
- 5.7.2.1 Brazil
- 5.7.2.2 Argentina
- 5.7.2.3 Rest of South America
- 5.7.3 Europe
- 5.7.3.1 Germany
- 5.7.3.2 United Kingdom
- 5.7.3.3 France
- 5.7.3.4 Italy
- 5.7.3.5 Spain
- 5.7.3.6 Rest of Europe
- 5.7.4 Asia-Pacific
- 5.7.4.1 China
- 5.7.4.2 India
- 5.7.4.3 Japan
- 5.7.4.4 South Korea
- 5.7.4.5 Rest of Asia-Pacific
- 5.7.5 Middle East and Africa
- 5.7.5.1 United Arab Emirates
- 5.7.5.2 Saudi Arabia
- 5.7.5.3 South Africa
- 5.7.5.4 Turkey
- 5.7.5.5 Rest of the Middle East and Africa
- 5.7.1 North America
6 Competitive Landscape
- 6.1 Market Concentration
- 6.2 Strategic Moves
- 6.3 Market Share Analysis
- 6.4 Company Profiles (includes Global Level Overview, Market Level Overview, Core Segments, Financials as Available, Strategic Information, Market Rank/Share for Key Companies, Products and Services, SWOT Analysis, and Recent Developments)
- 6.4.1 ABB Ltd
- 6.4.2 Siemens AG
- 6.4.3 Tesla, Inc.
- 6.4.4 Schneider Electric SE
- 6.4.5 ChargePoint Holdings, Inc.
- 6.4.6 Delta Electronics, Inc.
- 6.4.7 Tritium Charging
- 6.4.8 EVBox
- 6.4.9 Efacec
- 6.4.10 Heliox Energy
- 6.4.11 Alpitronic
- 6.4.12 Kempower
- 6.4.13 Phihong
- 6.4.14 Blink Charging Co.
- 6.4.15 Star Charge
- 6.4.16 Huawei Digital Power Technologies Co., Ltd.
- 6.4.17 BYD Company Limted
- 6.4.18 Zeekr Power
7 Market Opportunities & Future Outlook
- 7.1 White-space & Unmet-Need Assessment

