PUBLISHER: Mordor Intelligence | PRODUCT CODE: 2114448

PUBLISHER: Mordor Intelligence | PRODUCT CODE: 2114448
Beverage Container - Market Share Analysis, Industry Trends & Statistics, Growth Forecasts (2026 - 2031)
According to Mordor Intelligence, the beverage container market size is USD 231.03 billion in 2026 and is projected to reach USD 305.55 billion by 2031, registering a 5.75% CAGR over the period.
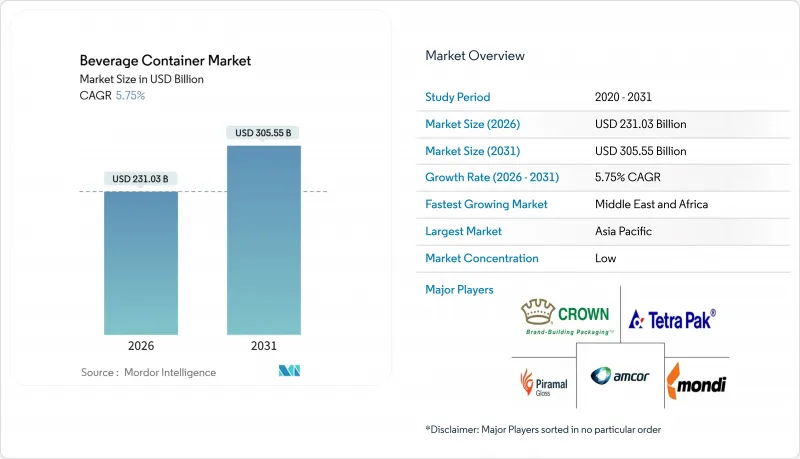
This report is Segmented by Material (Plastic, Metal, Glass, Paper, and Compostable and Biodegradable Materials), Beverages Type (Alcoholic, and Non-Alcoholic), Packaging Type (Bottles and Jars, Cans, Pouches, Bag-In-Box, and Cartons), Distribution Channel (Direct, and Indirect), and Geography (North America, South America, Europe, and More). The Market Forecasts are Provided in Terms of Value (USD).
Global Beverage Container Market Trends and Insights
Surging Consumption of Ready-to-Drink Non-Alcoholic Beverages
Health and convenience motives are steering consumers toward grab-and-go coffees, teas, and functional waters. Brand owners report double-digit volume gains in ready-to-drink lines, and launches featuring electrolytes or adaptogens now exceed one-fifth of all non-alcoholic introductions. This shift demands aseptic filling, advanced barrier coatings, and nitrogen-flush capabilities that safeguard nutrients without refrigeration. Thin-wall PET coupled with tamper-evident closures dominates new specifications. Converter investment is flowing into servo-driven blow-molding and inline vision systems that detect sub-50-micron wall variations, ensuring lightweight integrity at scale.
Rising Demand for Convenient and Lightweight PET Bottles
Lightweighting has moved from a cost tactic to a brand differentiator. Coca-Cola's 13.2-gram contour bottle reduced virgin resin use by 8% while maintaining top-load performance, preventing 6,000 metric tons of material consumption annually. Equipment vendors now offer stretch-blow platforms capable of 9-gram half-liter designs that withstand pallet loads exceeding 12 kilogram-force. Regulatory triggers accelerate the trend; the European Union mandates 25% recycled content in PET by 2025, amplifying the economic case for lighter walls that offset higher rPET costs. Life-cycle assessments confirm that shaving a single gram across a multi-billion-unit fleet trims thousands of metric tons of CO2 equivalents, aligning with Science Based Targets initiative benchmarks.
Stringent Global Regulations Against Single-Use Plastics
Policy divergence forces multinational portfolios to juggle tethered closures in Europe, refillables in British Columbia, and 30% rPET content in India. Non-alignment inflates compliance overheads, accelerates format substitution toward aluminum and glass, and complicates global SKU harmonization. Value brands struggle most, since a 330-milliliter aluminum can can cost nearly double its PET counterpart in price-sensitive markets, limiting adoption despite better recyclability.
Other drivers and restraints analyzed in the detailed report include:
- Expansion of Middle-Class Disposable Income in Emerging Economies
- Growth in Sustainable and Recyclable Packaging Mandates
- Volatility in Raw Material Prices for Aluminum and PET Resins
For complete list of drivers and restraints, kindly check the Table Of Contents.
Segment Analysis
Plastic retained 48.54% of the beverage container market share in 2025, powered mainly by PET's clarity, barrier versatility, and global recycling infrastructure. The segment's momentum, however, confronts stricter recycled-content rules that lift costs and shift innovation budgets toward weight reduction and chemical recycling. Metal holds roughly 28% share as aluminum cans gain favor in energy drinks and craft beer owing to infinite recyclability and premium shelf appeal. Glass sits near 16%, defending wine, spirits, and premium juice niches where inertness and transparency warrant higher logistics costs.
Compostable and biodegradable resins are moving from pilot scale to commercialization, expanding at a 7.32% CAGR to 2031. Seaweed-based capsules for sports drinks, FDA-approved polyhydroxyalkanoate bottles, and corn-starch films for ambient tea all speak to brands seeking end-of-life differentiation. Yet industrial composting gaps outside Western Europe and California temper broad uptake. Paper cartons and hybrid laminates round out the remainder, but face Extended Producer Responsibility penalties when multi-layer formats impede closed-loop recovery.
Non-alcoholic lines composed 63.32% of market share in 2025 and are on track for 6.64% CAGR through 2031, underpinning overall beverage container market growth. Carbonated soft drinks still lead units but now rely on aspartame-resistant PET to support diet variants that skirt new sugar taxes. Cold-pressed juices, plant-based milks, and protein shakes favor glass or opaque HDPE to signal freshness and nutritional integrity. Kombucha and functional waters, although smaller in absolute liters, post high-single-digit gains and typically choose amber glass or slim aluminum to shield probiotics from UV degradation.
Alcoholic beverages make up the balance with 36.68% share. Aluminum can adoption is rising in craft beer and ready-to-drink cocktails because cans chill faster, weigh less, and avoid event-venue glass bans. Bag-in-box wine now captures double-digit volume in Scandinavia and Australia by offering portion control and longer post-opening freshness. Spirits experiment with 200-milliliter aluminum bottles that suit festivals and e-commerce parcel shipping, though glass continues to dominate mainstream formats.
Complete Report Scope:
- By Material
- Plastic
- Metal
- Glass
- Paper
- Compostable and Biodegradable Materials (cornstarch, sugarcane, or algae)
- By Beverages Type
- Alcoholic
- Beer
- Wine
- Spirits
- Other Alcoholic Beverages
- Non-Alcoholic
- Juices
- Carbonated Soft Drinks (CSDs)
- Dairy-based Drinks
- Other Non-Alcoholic Beverages
- Alcoholic
- By Packaging Type
- Bottles and Jars
- Cans
- Pouches
- Bag-in-Box
- Cartons
- By Distribution Channel
- Direct
- Indirect
- By Geography
- North America
- United States
- Canada
- Mexico
- South America
- Brazil
- Argentina
- Rest of South America
- Europe
- Germany
- United Kingdom
- France
- Italy
- Spain
- Rest of Europe
- Asia-Pacific
- China
- India
- Japan
- South Korea
- Australia
- Rest of Asia-Pacific
- Middle East and Africa
- Middle East
- Saudi Arabia
- United Arab Emirates
- Turkey
- Rest of Middle East
- Africa
- South Africa
- Egypt
- Nigeria
- Rest of Africa
- Middle East
- North America
Geography Analysis
Asia-Pacific generated 40.23% of market share in 2025, anchored by China's ready-to-drink tea boom and India's accelerating cold-chain build-out. Japanese can makers innovate with resealable tops and thermochromic inks, while Australia's deposit-return scheme has pushed PET recovery above 85%. Local bottlers across Southeast Asia are installing high-speed lines for smaller pack sizes that mesh with rising urban commuter lifestyles.
The Middle East and Africa offer the fastest expansion path, with a 7.84% CAGR through 2031. Vision 2030 funding in Saudi Arabia underwrites beverage production hubs, and the United Arab Emirates' premium water market is shifting from PET to lightweight glass. Egypt and Nigeria see dual drivers of population growth and import substitution, although infrastructure gaps outside tier-one cities temper immediate volume upside. Deposit-return pilots and sugar taxes are also nudging format innovation toward downsized PET and lightweight cans.
Europe holds about a 22% share, distinguished by stringent Extended Producer Responsibility fees and deposit-return mandates that drive closed-loop aluminum and high-rPET usage. Germany now recovers more than 9 out of 10 single-use plastic bottles, forming a critical feedstock pool for domestic recyclers. France and the United Kingdom impose escalating penalties for virgin plastics, catalyzing refills and mono-material pouches with certified recyclability. North America contributes close to 18% share, with California's recycled-content law shaping nationwide sourcing strategies as producers aim for 65% recycled plastic by 2032. South America rounds out the global map, where high returnable glass penetration in Brazil keeps packaging costs low and lifts consumer loyalty to refill systems.
- Amcor plc
- Ball Corporation
- Crown Holdings Incorporated
- Ardagh Group S.A.
- Owens-Illinois Inc.
- Tetra Pak International S.A.
- Mondi Group
- Smurfit WestRock
- Vetropack Holding AG
- Gerresheimer AG
- Piramal Glass Private Limited
- Alpha Packaging Inc.
- Consolidated Container Company LLC
- Silgan Holdings Inc.
- Can-Pack S.A.
- Graphic Packaging International
- Tetra Pak International S.A.
- SIG Group International AG
Additional Benefits:
- The market estimate (ME) sheet in Excel format
- 3 months of analyst support
TABLE OF CONTENTS
1 INTRODUCTION
- 1.1 Study Assumptions and Market Definition
- 1.2 Scope of the Study
2 RESEARCH METHODOLOGY
3 EXECUTIVE SUMMARY
4 MARKET LANDSCAPE
- 4.1 Market Overview
- 4.2 Market Drivers
- 4.2.1 Surging Consumption of Ready-to-Drink Non-Alcoholic Beverages
- 4.2.2 Rising Demand for Convenient and Lightweight PET Bottles
- 4.2.3 Expansion of Middle-Class Disposable Income in Emerging Economies
- 4.2.4 Growth in Sustainable and Recyclable Packaging Mandates
- 4.2.5 Adoption of Digital Watermarking for Automated Sorting
- 4.2.6 Beverage Brands' Shift Toward Direct-to-Consumer E-Commerce Formats
- 4.3 Market Restraints
- 4.3.1 Stringent Global Regulations Against Single-Use Plastics
- 4.3.2 Volatility in Raw Material Prices for Aluminum and PET Resins
- 4.3.3 Limited Food-Grade rPET Feedstock Availability
- 4.3.4 Emerging Refillable and Reuse Systems Cannibalizing Single-Use Volumes
- 4.4 Industry Value Chain Analysis
- 4.5 Impact of Macroeconomic Factors on the Market
- 4.6 Regulatory Landscape
- 4.7 Technological Outlook
- 4.8 Porter's Five Forces Analysis
- 4.8.1 Bargaining Power of Suppliers
- 4.8.2 Bargaining Power of Buyers/Consumers
- 4.8.3 Threat of New Entrants
- 4.8.4 Threat of Substitute Products
- 4.8.5 Intensity of Competitive Rivalry
5 MARKET SIZE AND GROWTH FORECASTS (VALUE)
- 5.1 By Material
- 5.1.1 Plastic
- 5.1.2 Metal
- 5.1.3 Glass
- 5.1.4 Paper
- 5.1.5 Compostable and Biodegradable Materials (cornstarch, sugarcane, or algae)
- 5.2 By Beverages Type
- 5.2.1 Alcoholic
- 5.2.1.1 Beer
- 5.2.1.2 Wine
- 5.2.1.3 Spirits
- 5.2.1.4 Other Alcoholic Beverages
- 5.2.2 Non-Alcoholic
- 5.2.2.1 Juices
- 5.2.2.2 Carbonated Soft Drinks (CSDs)
- 5.2.2.3 Dairy-based Drinks
- 5.2.2.4 Other Non-Alcoholic Beverages
- 5.2.1 Alcoholic
- 5.3 By Packaging Type
- 5.3.1 Bottles and Jars
- 5.3.2 Cans
- 5.3.3 Pouches
- 5.3.4 Bag-in-Box
- 5.3.5 Cartons
- 5.4 By Distribution Channel
- 5.4.1 Direct
- 5.4.2 Indirect
- 5.5 By Geography
- 5.5.1 North America
- 5.5.1.1 United States
- 5.5.1.2 Canada
- 5.5.1.3 Mexico
- 5.5.2 South America
- 5.5.2.1 Brazil
- 5.5.2.2 Argentina
- 5.5.2.3 Rest of South America
- 5.5.3 Europe
- 5.5.3.1 Germany
- 5.5.3.2 United Kingdom
- 5.5.3.3 France
- 5.5.3.4 Italy
- 5.5.3.5 Spain
- 5.5.3.6 Rest of Europe
- 5.5.4 Asia-Pacific
- 5.5.4.1 China
- 5.5.4.2 India
- 5.5.4.3 Japan
- 5.5.4.4 South Korea
- 5.5.4.5 Australia
- 5.5.4.6 Rest of Asia-Pacific
- 5.5.5 Middle East and Africa
- 5.5.5.1 Middle East
- 5.5.5.1.1 Saudi Arabia
- 5.5.5.1.2 United Arab Emirates
- 5.5.5.1.3 Turkey
- 5.5.5.1.4 Rest of Middle East
- 5.5.5.2 Africa
- 5.5.5.2.1 South Africa
- 5.5.5.2.2 Egypt
- 5.5.5.2.3 Nigeria
- 5.5.5.2.4 Rest of Africa
- 5.5.5.1 Middle East
- 5.5.1 North America
6 COMPETITIVE LANDSCAPE
- 6.1 Market Concentration
- 6.2 Strategic Moves
- 6.3 Market Share Analysis
- 6.4 Company Profiles (includes Global Level Overview, Market Level Overview, Core Segments, Financials as available, Strategic Information, Market Rank/Share, Products and Services, and Recent Developments)
- 6.4.1 Amcor plc
- 6.4.2 Ball Corporation
- 6.4.3 Crown Holdings Incorporated
- 6.4.4 Ardagh Group S.A.
- 6.4.5 Owens-Illinois Inc.
- 6.4.6 Tetra Pak International S.A.
- 6.4.7 Mondi Group
- 6.4.8 Smurfit WestRock
- 6.4.9 Vetropack Holding AG
- 6.4.10 Gerresheimer AG
- 6.4.11 Piramal Glass Private Limited
- 6.4.12 Alpha Packaging Inc.
- 6.4.13 Consolidated Container Company LLC
- 6.4.14 Silgan Holdings Inc.
- 6.4.15 Can-Pack S.A.
- 6.4.16 Graphic Packaging International
- 6.4.17 Tetra Pak International S.A.
- 6.4.18 SIG Group International AG
7 MARKET OPPORTUNITIES AND FUTURE OUTLOOK
- 7.1 White-Space and Unmet-Need Assessment

