PUBLISHER: Mordor Intelligence | PRODUCT CODE: 2114502

PUBLISHER: Mordor Intelligence | PRODUCT CODE: 2114502
Cloud Billing - Market Share Analysis, Industry Trends & Statistics, Growth Forecasts (2026 - 2031)
According to Mordor Intelligence, cloud billing market size in 2026 is estimated at USD 15.83 billion, growing from 2025 value of USD 13.87 billion with 2031 projections showing USD 30.64 billion, growing at 14.12% CAGR over 2026-2031.
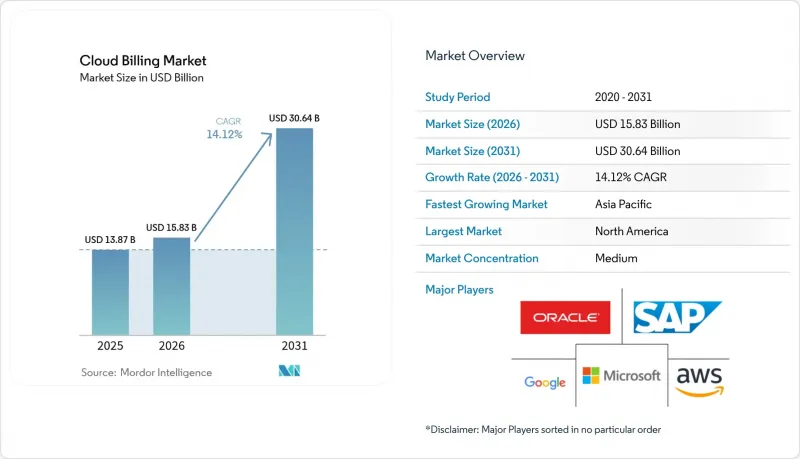
This report is Segmented by Deployment (Public Cloud, Private Cloud, and Hybrid Cloud), Component (Platform and Services), Billing Model (Subscription-Based, Usage-Based, and Hybrid), Cloud Service Model (SaaS Billing, Paas Billing, and IaaS Billing), Organization Size (Large Enterprises and SMEs), End-User Industry (BFSI, and More), and Geography. The Market Forecasts are Provided in Terms of Value (USD).
Global Cloud Billing Market Trends and Insights
Accelerating Multi-Cloud Adoption
Multi-cloud strategies are gaining popularity as organizations distribute workloads to balance resilience, pricing, and data-residency requirements. Policy-driven resource controls inside Kubernetes have demonstrated that finely tuned autoscaling curbs unpredictable spend while maintaining governance. Billing platforms now reconcile divergent price books, currencies, and taxonomies in real time and supply chargeback reports that promote unit-level accountability. The cloud billing market gains momentum as hyperscalers publish consumption APIs that shorten data ingestion cycles and as enterprises mitigate single-vendor risk by embracing provider diversity. Demand, therefore, concentrates on billing engines that normalise multi-cloud telemetry and present unified dashboards.
Expansion of E-Commerce Subscription Models
Subscription commerce no longer applies exclusively to SaaS. Retailers integrate physical goods, content bundles, and hybrid memberships that require intricate proration, tiered add-ons, and cyclical promotions. Platforms must orchestrate price adjustments triggered by customer behaviour and localise checkout in line with country-specific payment methods, PSD2 mandates, and GDPR obligations. Growth in recurring commerce strengthens the cloud billing market by broadening the user base from software publishers to merchants that ship tangible products.
Migration Complexities from Legacy On-Premises Billing
Long-standing on-prem billing stacks often carry undocumented business logic, making data mapping and rule translation difficult. Enterprises in regulated verticals simultaneously uphold PCI-DSS, SOX, or HIPAA mandates during cut-over, obliging dual-run environments that inflate project budgets. The resource burden deters some organisations from full transition and tempers the near-term expansion pace of the cloud billing market.
Other drivers and restraints analyzed in the detailed report include:
- Rising Demand for Real-Time Usage-Based Pricing
- Token-Based Cloud Consumption Models in Web3 Startups
- Data-Sovereignty and Cross-Border Compliance Costs
For complete list of drivers and restraints, kindly check the Table Of Contents.
Segment Analysis
Hybrid environments are recording a 15.81% CAGR as organisations pair on-prem assets with hyperscale elasticity. Enterprises value the ability to shift workloads without forfeiting data residency or latency-sensitive processing, yet they often encounter fragmented cost structures. Billing vendors respond by releasing adapters that harmonise private-cloud telemetry with public-cloud rate cards.
Public deployment maintains a 66.10% revenue lead due to its simplicity and broad tooling ecosystems. Nevertheless, compliance triggers, edge use cases, and geopolitics strengthen the case for hybrid spend governance. The cloud billing market, therefore, pivots toward unified orchestration engines that calculate blended effective rates and surface variance reports across locations.
Services revenue is climbing at 16.62% CAGR as enterprises outsource roadmap planning, integration, and optimisation. Providers bundle advisory, implementation, and managed operations that target rapid payback. Platforms continue to dominate with a 60.10% share, yet service-led engagement secures footholds in regulated domains where bespoke controls are pivotal.
The cloud billing market benefits because service specialists translate domain nuances into configuration baselines that shrink deployment risk. Bundled offerings that pair platform licences with lifecycle services foster stickier contracts and unlock expansion into adjacent cost-governance modules such as carbon tracing and partner settlement.
Complete Report Scope:
- By Deployment
- Public Cloud
- Private Cloud
- Hybrid Cloud
- By Component
- Platform
- Services
- By Billing Model
- Subscription-based
- Usage-based
- Hybrid (Subscription + Usage)
- By Cloud Service Model
- SaaS Billing
- PaaS Billing
- IaaS Billing
- By Organization Size
- Large Enterprises
- Small and Medium Enterprises (SMEs)
- By End-user Industry
- Retail and E-commerce
- BFSI
- Telecommunications
- Healthcare and Life Sciences
- Energy and Utilities
- Government and Public Sector
- Media and Entertainment
- Other End-user Industries
- By Geography
- North America
- United States
- Canada
- Mexico
- South America
- Brazil
- Argentina
- Chile
- Rest of South America
- Europe
- Germany
- United Kingdom
- France
- Italy
- Spain
- Russia
- Rest of Europe
- Asia Pacific
- China
- India
- Japan
- South Korea
- Singapore
- Malaysia
- Australia
- Rest of Asia Pacific
- Middle East and Africa
- Middle East
- United Arab Emirates
- Saudi Arabia
- Turkey
- Rest of Middle East
- Africa
- South Africa
- Nigeria
- Egypt
- Rest of Africa
- Middle East
- North America
Geography Analysis
North America generated 36.80% of 2025 revenue and continues to benefit from a concentration of hyperscalers, venture funding, and FinOps talent. The region rewards vendors that comply with frameworks such as SOX and state-level privacy statutes. High usage of AI workloads also catalyzes the adoption of token-metered services, reinforcing demand for real-time rating.
The Asia-Pacific region posts the fastest growth rate of 16.28% CAGR, driven by public-sector digitization, mobile-first consumer bases, and sovereign AI computing initiatives. India's national GPU programme exemplifies how government grants catalyse cloud capacity that must be monetised through scalable billing. Japan's carbon-linked battery network highlights regional appetite for merging cost with environmental KPIs. Providers that bundle localisation and language support gain early footholds.
Europe balances GDPR leadership with emerging digital sovereignty plans. Enterprises require local data centres and transparent data-processing chains, so billing platforms that guarantee regional residency gain preference. Initiatives encouraging carbon-aware scheduling drive the cloud billing market toward environmental chargeback reports. Fragmented national rules prolong procurement cycles, yet they also amplify barriers for newcomers and solidify loyalty to vendors adept at navigating compliance nuances.
- Amazon Web Services (AWS) Inc.
- Microsoft Corporation (Azure)
- Google Cloud Platform
- Oracle Corporation
- SAP SE
- Salesforce Inc. (Revenue Cloud)
- Zuora Inc.
- Aria Systems Inc.
- BillingPlatform LLC
- FinancialForce LLC
- IBM Corporation
- Comarch SA
- Tencent Cloud
- Huawei Cloud
- Alibaba Cloud
- CloudBlue (An Ingram Micro Co.)
- CloudHealth (Vmware)
- Chargebee Inc.
- Recurly Inc.
- Stripe Billing
- Paddle.com Market Ltd.
- ChargeOver LLC
- Vertex Inc.
- GoCardless Ltd.
- Orb Inc.
- SaaSOptics (An Ramped Co.)
- LogiSense Corp.
- Gotransverse LLC
- Rev.io Technologies
Additional Benefits:
- The market estimate (ME) sheet in Excel format
- 3 months of analyst support
TABLE OF CONTENTS
1 INTRODUCTION
- 1.1 Study Assumptions and Market Definition
- 1.2 Scope of the Study
2 RESEARCH METHODOLOGY
3 EXECUTIVE SUMMARY
4 MARKET LANDSCAPE
- 4.1 Market Overview
- 4.2 Market Drivers
- 4.2.1 Accelerating multi-cloud adoption
- 4.2.2 Expansion of e-commerce subscription models
- 4.2.3 Rising demand for real-time usage-based pricing
- 4.2.4 Token-based cloud consumption models in Web3 startups
- 4.2.5 Carbon-aware workload scheduling incentives
- 4.2.6 Integration of AI-driven cost optimization engines
- 4.3 Market Restraints
- 4.3.1 Migration complexities from legacy on-prem billing
- 4.3.2 Data-sovereignty and cross-border compliance costs
- 4.3.3 Rising FinOps tooling cannibalising native billing margins
- 4.3.4 Vendor lock-in and interoperability challenges
- 4.4 Industry Value Chain Analysis
- 4.5 Regulatory Landscape
- 4.6 Technological Outlook (Generative AI for automated invoicing)
- 4.7 Porter's Five Forces Analysis
- 4.7.1 Bargaining Power of Suppliers
- 4.7.2 Bargaining Power of Buyers
- 4.7.3 Threat of New Entrants
- 4.7.4 Threat of Substitutes
- 4.7.5 Intensity of Competitive Rivalry
- 4.8 Impact of Macroeconomic Factors on the Market
5 MARKET SIZE AND GROWTH FORECASTS (VALUES)
- 5.1 By Deployment
- 5.1.1 Public Cloud
- 5.1.2 Private Cloud
- 5.1.3 Hybrid Cloud
- 5.2 By Component
- 5.2.1 Platform
- 5.2.2 Services
- 5.3 By Billing Model
- 5.3.1 Subscription-based
- 5.3.2 Usage-based
- 5.3.3 Hybrid (Subscription + Usage)
- 5.4 By Cloud Service Model
- 5.4.1 SaaS Billing
- 5.4.2 PaaS Billing
- 5.4.3 IaaS Billing
- 5.5 By Organization Size
- 5.5.1 Large Enterprises
- 5.5.2 Small and Medium Enterprises (SMEs)
- 5.6 By End-user Industry
- 5.6.1 Retail and E-commerce
- 5.6.2 BFSI
- 5.6.3 Telecommunications
- 5.6.4 Healthcare and Life Sciences
- 5.6.5 Energy and Utilities
- 5.6.6 Government and Public Sector
- 5.6.7 Media and Entertainment
- 5.6.8 Other End-user Industries
- 5.7 By Geography
- 5.7.1 North America
- 5.7.1.1 United States
- 5.7.1.2 Canada
- 5.7.1.3 Mexico
- 5.7.2 South America
- 5.7.2.1 Brazil
- 5.7.2.2 Argentina
- 5.7.2.3 Chile
- 5.7.2.4 Rest of South America
- 5.7.3 Europe
- 5.7.3.1 Germany
- 5.7.3.2 United Kingdom
- 5.7.3.3 France
- 5.7.3.4 Italy
- 5.7.3.5 Spain
- 5.7.3.6 Russia
- 5.7.3.7 Rest of Europe
- 5.7.4 Asia Pacific
- 5.7.4.1 China
- 5.7.4.2 India
- 5.7.4.3 Japan
- 5.7.4.4 South Korea
- 5.7.4.5 Singapore
- 5.7.4.6 Malaysia
- 5.7.4.7 Australia
- 5.7.4.8 Rest of Asia Pacific
- 5.7.5 Middle East and Africa
- 5.7.5.1 Middle East
- 5.7.5.1.1 United Arab Emirates
- 5.7.5.1.2 Saudi Arabia
- 5.7.5.1.3 Turkey
- 5.7.5.1.4 Rest of Middle East
- 5.7.5.2 Africa
- 5.7.5.2.1 South Africa
- 5.7.5.2.2 Nigeria
- 5.7.5.2.3 Egypt
- 5.7.5.2.4 Rest of Africa
- 5.7.5.1 Middle East
- 5.7.1 North America
6 COMPETITIVE LANDSCAPE
- 6.1 Market Concentration
- 6.2 Strategic Moves
- 6.3 Market Share Analysis
- 6.4 Company Profiles (includes Global level Overview, Market level overview, Core Segments, Financials as available, Strategic Information, Market Rank/Share for key companies, Products and Services, and Recent Developments)
- 6.4.1 Amazon Web Services (AWS) Inc.
- 6.4.2 Microsoft Corporation (Azure)
- 6.4.3 Google Cloud Platform
- 6.4.4 Oracle Corporation
- 6.4.5 SAP SE
- 6.4.6 Salesforce Inc. (Revenue Cloud)
- 6.4.7 Zuora Inc.
- 6.4.8 Aria Systems Inc.
- 6.4.9 BillingPlatform LLC
- 6.4.10 FinancialForce LLC
- 6.4.11 IBM Corporation
- 6.4.12 Comarch SA
- 6.4.13 Tencent Cloud
- 6.4.14 Huawei Cloud
- 6.4.15 Alibaba Cloud
- 6.4.16 CloudBlue (An Ingram Micro Co.)
- 6.4.17 CloudHealth (Vmware)
- 6.4.18 Chargebee Inc.
- 6.4.19 Recurly Inc.
- 6.4.20 Stripe Billing
- 6.4.21 Paddle.com Market Ltd.
- 6.4.22 ChargeOver LLC
- 6.4.23 Vertex Inc.
- 6.4.24 GoCardless Ltd.
- 6.4.25 Orb Inc.
- 6.4.26 SaaSOptics (An Ramped Co.)
- 6.4.27 LogiSense Corp.
- 6.4.28 Gotransverse LLC
- 6.4.29 Rev.io Technologies
7 MARKET OPPORTUNITIES AND FUTURE TRENDS
- 7.1 White-Space and Unmet-Need Assessment

