PUBLISHER: Mordor Intelligence | PRODUCT CODE: 2114513

PUBLISHER: Mordor Intelligence | PRODUCT CODE: 2114513
Aquafeed Additives - Market Share Analysis, Industry Trends & Statistics, Growth Forecasts (2026 - 2031)
According to Mordor Intelligence, aquafeed additives market size market size in 2026 is estimated at USD 3.03 billion, growing from 2025 value of USD 2.9 billion with 2031 projections showing USD 3.79 billion, growing at 4.55% CAGR over 2026-2031.
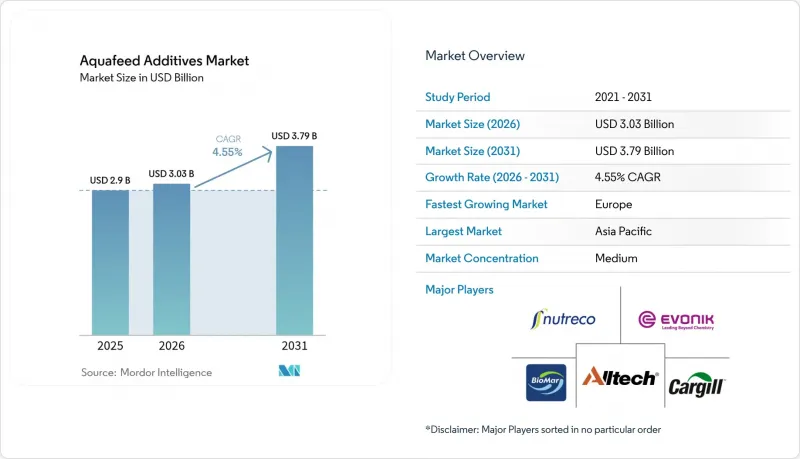
This report is Segmented by Species Type (Fish, Mollusks, Crustaceans, and Others), by Additives Type (Vitamins, Minerals, Antioxidants, Amino Acids, Enzymes, Acidifiers, and More), by Form (Dry Extruded Pellets, Moist Pellets, and More) and by Geography (North America, Europe, Asia-Pacific, South America, and More). The Market Forecasts are Provided in Terms of Value (USD).
Global Aquafeed Additives Market Trends and Insights
Rising Global Seafood Consumption and Protein Shift
Global protein demand is moving toward aquatic sources. Africa alone is forecast to raise seafood intake from 10 million metric tons to 29 million metric tons by 2050, a trajectory mirrored in Asia, where tilapia integrators are localizing feed mills to cut imports. FAO expects farm-raised fish prices to climb 24% by 2030, encouraging producers to adopt additives that deliver faster growth and shorten production cycles. Retailers such as Albert Heijn now stock shrimp fed on insect meal and algal oil, signaling buyer acceptance of alternative feed technologies. This demand pivot supports amino acid and enzyme use in plant-based diets that replace fishmeal while sustaining optimal amino-acid profiles for performance. Consequently, the aquafeed additives market gains resilience against fishmeal volatility.
Expansion of Intensive Aquaculture Capacity
Saudi firm NAQUA operates 500 ponds and targets 250,000 metric tons of annual output by 2030, highlighting the global shift toward high-density systems that rely on robust probiotic and water-quality programs. In China, intensive shrimp farms produced 2.09 million metric tons in 2022, yet faced germplasm depletion and disease risks that drive uptake of immune-boosting additives. Recirculating aquaculture systems and biofloc require precision nutrient packages to sustain microbial balance, creating premium demand pockets. The aquafeed additives market, therefore, benefits from clustered, technology-driven expansions across Asia, the Middle East, and South America.
Volatile Fishmeal and Fish-Oil Pricing Impacting Additive Cost Pass-Through
Volatile fishmeal and fish-oil prices disrupt aquafeed additive manufacturers, complicating cost pass-through and profitability. Peru's 300% surge in fishmeal output lifted global production by 75% in January 2025, yet price swings restrict manufacturers' ability to price through additive premiums. Fish oil output climbed 34%, but suppliers leveraged compressed margins as feed makers struggled to absorb dual cost pressures. China's aquafeed output fell 3.5% in 2024 amid flooding and farmer cost-cutting, illustrating how volatility curbs additive uptake. FAO foresees fishmeal prices rising 30% by 2030, quickening the search for insect meal or single-cell proteins that demand new additive calibrations. Supply-chain uncertainty, particularly the reliance on frozen fish inputs until September 2025, complicates inventory planning for the aquafeed additives market.
Other drivers and restraints analyzed in the detailed report include:
- Government Subsidies and Sustainability Mandates in Aquaculture
- Functional Additives Replacing In-Feed Antibiotics
- Stringent Multi-Region Approval Timelines for Novel Feed Additives
For complete list of drivers and restraints, kindly check the Table Of Contents.
Segment Analysis
Fish represented 52.85% of the aquafeed additives market share in 2025, remaining the largest consumer group due to the extensive farming of salmon, tilapia, and carp globally. This dominance converted into an estimated USD 1.53 billion slice of the aquafeed additives market size in 2025, illustrating the purchasing power of operators that have standardized additive protocols to safeguard feed-conversion ratios. Salmon producers in Norway and Chile continue to layer functional amino acids and antioxidants that counteract stress during high-density grow-out and transport phases, the Asian carp farms emphasize cost-effective vitamin and enzyme packages to hit tight feed budgets. Established feed mills already integrate digital traceability, so any additive that demonstrates a measurable uplift in feed efficiency or fillet yield quickly scales through long-term supply contracts. Consequently, fish farming sets the baseline specification that most suppliers use when validating new ingredients.
Crustaceans, led by shrimp, display the fastest adoption curve with a 8.92% CAGR through 2031 as producers justify the higher additive spend to offset still-elevated disease risks and achieve premium coloration. Trials using 5% astaxanthin-rich krill oil have delivered 100% survival under salinity stress while raising market value through deeper pigmentation, reinforcing willingness to pay for specialty inputs. Chinese farmers continue turning to multi-phase functional diets that include immunostimulant probiotics, the South American growers focus on encapsulated phytogenics that resist leaching in brackish ponds. Mollusks and niche species such as sea cucumbers remain small but notable, with micronized mineral blends enhancing shell strength and texture attributes that fetch superior prices in gourmet channels. As demand diversifies, suppliers tailor species-specific additive bundles, positioning the aquafeed additives market for steady volume and value gains across distinct production segments.
Complete Report Scope:
- By Species Type
- Fish
- Salmonids
- Tilapia
- Carp
- Catfish
- Mollusks
- Crustaceans
- Others
- Fish
- By Additive Type
- Vitamins
- Minerals
- Antioxidants
- Amino Acids
- Enzymes
- Acidifiers
- Probiotics and Prebiotics
- Phytogenics and Essential Oils
- Others (Carotenoids/Astaxanthin, Pellet Binders/Bentonite, etc.)
- By Form
- Dry Extruded Pellets
- Moist Pellets
- Micro-encapsulated Powders
- By Geography
- North America
- United States
- Canada
- Mexico
- Rest of North America
- Europe
- Germany
- United Kingdom
- France
- Spain
- Russia
- Rest of Europe
- Asia-Pacific
- China
- India
- Japan
- Vietnam
- Rest of Asia-Pacific
- South America
- Brazil
- Argentina
- Rest of South America
- Middle East
- Turkey
- Saudi Arabia
- Rest of Middle East
- Africa
- South Africa
- Rest of Africa
- North America
Geography Analysis
Asia-Pacific contributed 61.05% of global revenue in 2025 and continues to anchor volume growth, led by China's shrimp production surpassing 2 million metric tons. Disease outbreaks and protein-source shifts compel farms to layer immune-enhancing additives on top of core amino-acid packages. Vietnam and India are expanding export-oriented aquaculture, but price sensitivity shapes a two-tier market where premium additives coexist with cost-optimized blends.
Europe's aquafeed additives market size is projected to expand from USD 0.56 billion in 2026 to USD 0.83 billion by 2031 on an 8.05% CAGR as EU directives elevate sustainability requirements. Norway's salmon sector leads precision feeding adoption, catalyzing trials of AI-supported dosing systems that elevate functional additive use efficiency. Horizon Europe projects funnel more than EUR 6 million (USD 6.95 million) into green-feed research annually, accelerating the commercialization of algae-derived antioxidants and phytonutrients.
North America presents a mature but innovation-friendly landscape. The US Strategic Plan for Aquaculture backs public-private infrastructures where additive developers pilot novel proteins or bacteriophage solutions under controlled conditions. Canada's engagement with indigenous rights adds ESG layers that reward eco-friendly formulations. Meanwhile, Mexico's shrimp operators deepen cross-border supplier ties, boosting additive throughput.
- Benchmark Holdings plc (INVE Aquaculture)
- BASF SE
- Evonik Industries AG
- Adisseo
- Cargill, Incorporated
- Archer Daniels Midland (ADM)
- BioMar Group
- Alltech
- Nutreco N.V. (Skretting)
- Zeigler Feeds
- Kemin Industries, Inc.
- Phibro Animal Health Corporation
- Calysta Inc.
- Bentoli
- Phytobiotics Futterzusatzstoffe GmbH
Additional Benefits:
- The market estimate (ME) sheet in Excel format
- 3 months of analyst support
TABLE OF CONTENTS
1 Introduction
- 1.1 Study Assumptions and Market Definition
- 1.2 Scope of the Study
2 Research Methodology
3 Executive Summary
4 Market Landscape
- 4.1 Market Overview
- 4.2 Market Drivers
- 4.2.1 Rising global seafood consumption and protein shift
- 4.2.2 Expansion of intensive aquaculture capacity
- 4.2.3 Government subsidies and sustainability mandates in aquaculture
- 4.2.4 Functional additives replacing in-feed antibiotics
- 4.2.5 Carbon-footprint labeling spurring micro-algae and single-cell additives
- 4.2.6 AI-driven precision feeding enabling higher specialty-additive inclusion
- 4.3 Market Restraints
- 4.3.1 Volatile fishmeal and fish-oil pricing impacting additive cost pass-through
- 4.3.2 Stringent multi-region approval timelines for novel feed additives
- 4.3.3 Micro-plastics scrutiny on pellet binders and coating agents
- 4.3.4 Climate-induced crop failures tightening phytobiotic supply
- 4.4 Regulatory Landscape
- 4.5 Technological Outlook
- 4.6 Porters Five Forces Analysis
- 4.6.1 Threat of New Entrants
- 4.6.2 Bargaining Power of Buyers/Consumers
- 4.6.3 Bargaining Power of Suppliers
- 4.6.4 Threat of Substitute Products
- 4.6.5 Intensity of Competitive Rivalry
5 Market Size and Growth Forecasts (Value)
- 5.1 By Species Type
- 5.1.1 Fish
- 5.1.1.1 Salmonids
- 5.1.1.2 Tilapia
- 5.1.1.3 Carp
- 5.1.1.4 Catfish
- 5.1.2 Mollusks
- 5.1.3 Crustaceans
- 5.1.4 Others
- 5.1.1 Fish
- 5.2 By Additive Type
- 5.2.1 Vitamins
- 5.2.2 Minerals
- 5.2.3 Antioxidants
- 5.2.4 Amino Acids
- 5.2.5 Enzymes
- 5.2.6 Acidifiers
- 5.2.7 Probiotics and Prebiotics
- 5.2.8 Phytogenics and Essential Oils
- 5.2.9 Others (Carotenoids/Astaxanthin, Pellet Binders/Bentonite, etc.)
- 5.3 By Form
- 5.3.1 Dry Extruded Pellets
- 5.3.2 Moist Pellets
- 5.3.3 Micro-encapsulated Powders
- 5.4 By Geography
- 5.4.1 North America
- 5.4.1.1 United States
- 5.4.1.2 Canada
- 5.4.1.3 Mexico
- 5.4.1.4 Rest of North America
- 5.4.2 Europe
- 5.4.2.1 Germany
- 5.4.2.2 United Kingdom
- 5.4.2.3 France
- 5.4.2.4 Spain
- 5.4.2.5 Russia
- 5.4.2.6 Rest of Europe
- 5.4.3 Asia-Pacific
- 5.4.3.1 China
- 5.4.3.2 India
- 5.4.3.3 Japan
- 5.4.3.4 Vietnam
- 5.4.3.5 Rest of Asia-Pacific
- 5.4.4 South America
- 5.4.4.1 Brazil
- 5.4.4.2 Argentina
- 5.4.4.3 Rest of South America
- 5.4.5 Middle East
- 5.4.5.1 Turkey
- 5.4.5.2 Saudi Arabia
- 5.4.5.3 Rest of Middle East
- 5.4.6 Africa
- 5.4.6.1 South Africa
- 5.4.6.2 Rest of Africa
- 5.4.1 North America
6 Competitive Landscape
- 6.1 Market Concentration
- 6.2 Strategic Moves
- 6.3 Market Share Analysis
- 6.4 Company Profiles (Includes Global-level Overview, Market-level Overview, Core Segments, Financials as available, Strategic Information, Market Rank/Share, Products and Services, and Recent Developments)
- 6.4.1 Benchmark Holdings plc (INVE Aquaculture)
- 6.4.2 BASF SE
- 6.4.3 Evonik Industries AG
- 6.4.4 Adisseo
- 6.4.5 Cargill, Incorporated
- 6.4.6 Archer Daniels Midland (ADM)
- 6.4.7 BioMar Group
- 6.4.8 Alltech
- 6.4.9 Nutreco N.V. (Skretting)
- 6.4.10 Zeigler Feeds
- 6.4.11 Kemin Industries, Inc.
- 6.4.12 Phibro Animal Health Corporation
- 6.4.13 Calysta Inc.
- 6.4.14 Bentoli
- 6.4.15 Phytobiotics Futterzusatzstoffe GmbH
7 Market Opportunities and Future Outlook

