PUBLISHER: Mordor Intelligence | PRODUCT CODE: 2114780

PUBLISHER: Mordor Intelligence | PRODUCT CODE: 2114780
Global Gene Delivery Systems - Market Share Analysis, Industry Trends & Statistics, Growth Forecasts (2026 - 2031)
According to Mordor Intelligence, the gene delivery systems market size is expected to grow from USD 6.19 billion in 2025 to USD 6.91 billion in 2026 and is forecast to reach USD 11.96 billion by 2031 at 11.60% CAGR over 2026-2031.
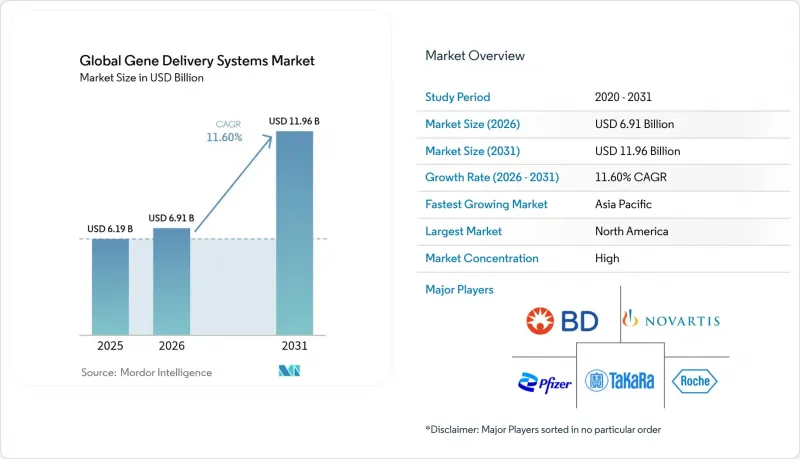
This report is Segmented by Delivery Systems (Viral Gene Delivery Systems, and More), Application (Oncology, Infectious Diseases, and More), Route of Administration (Injectable, Oral, and More), End User (Biopharma & Gene-Therapy Developers, and More), and Geography (North America, Europe, Asia-Pacific, Middle East & Africa, South America). The Market Forecasts are Provided in Terms of Value (USD).
Global Gene Delivery Systems Market Trends and Insights
Growing Burden of Chronic & Lifestyle Diseases
Rising prevalence of genetic and chronic disorders fuels demand for curative gene therapies that replace lifelong symptom management with one-time molecular correction. Sickle cell disease affects 100,000 Americans, and hemophilia B impacts 1 in 40,000 males worldwide, motivating developers to pursue durable treatments. CASGEVY's pivotal trial showed 96.7% of recipients free of vaso-occlusive crises for at least one year, validating the clinical and economic rationale for broader deployment. Success in hematologic indications accelerates exploration in cardiovascular, metabolic, and neurodegenerative diseases where conventional pharmacology offers limited long-term benefit.
Rapid R&D Advances by Biopharma Companies
Large pharmaceutical groups intensify gene-therapy pipelines through acquisitions and partnerships exceeding USD 1 billion each, such as Roche-Poseida and Novartis expansions in nervous-system disorders. AI-guided design shortens vector optimization cycles, enabling Regeneron, AstraZeneca, and CRISPR Therapeutics to progress multiple in-vivo programs simultaneously. This R&D velocity aligns with CDMO build-outs, ensuring production scalability for late-stage assets.
High Treatment & Reimbursement Costs
Pricing peaks at USD 4.25 million for Lenmeldy and USD 2.2 million for CASGEVY, out-stripping payer budgets and slowing uptake despite lifetime health-economic benefits. Outcomes-based agreements and installment models offer relief but remain inconsistently adopted, creating access disparities, particularly in low- and middle-income countries.
Other drivers and restraints analyzed in the detailed report include:
- Rising Approvals of Vector-Based Gene Therapies
- Venture and Strategic Funding Inflows
- AI-Driven Vector Design Tools
- Regional CDMO Build-Out of Plasmid Capacity
- Safety / Immune-Response Concerns for Viral Vectors
For complete list of drivers and restraints, kindly check the Table Of Contents.
Segment Analysis
Viral platforms captured 61.55% of 2025 revenue, led by AAV vectors validated in recent approvals. Lentiviral systems grow in ex-vivo oncology and hemoglobinopathies despite production complexity. Non-viral approaches expand at 12.98% CAGR, propelled by lipid nanoparticles delivering CRISPR payloads with 90-100% encapsulation efficiency. Hybrid technologies blending viral precision with synthetic materials promise manufacturability and regulatory flexibility. Collectively, these dynamics sustain the gene delivery systems market's transition toward diversified modalities.
Manufacturing capacity remains a pinch-point; industry surveys reveal potential lentiviral shortfalls without further scale-up. CDMOs respond with large-volume single-use bioreactors and continuous-flow purification that cut cycle times by 30%, narrowing the cost gap between viral and non-viral options.
Oncology held 47.62% of 2025 revenue, driven by CAR-T and solid-tumor gene therapies that demonstrably extend survival. Infectious-disease programs exhibit 12.42% CAGR through breakthroughs against HIV, herpes, and hepatitis B. Cardiovascular candidates advance with cBIN1 showing 30% functional improvement in large-animal models. Diabetes and pulmonary pipelines leverage inhaled and tissue-specific vectors that address longstanding delivery challenges. Orphan-disease portfolios benefit from accelerated review pathways, supporting a diverse set of rare-condition approvals.
Complete Report Scope:
- By Delivery Systems
- Viral Gene Delivery Systems
- Adenoviral Vectors
- Lentiviral Vectors
- Retroviral Vectors
- Other Viral Vectors (AAV, HSV, etc.)
- Non-viral Gene Delivery
- Combined / Hybrid Delivery Systems
- Viral Gene Delivery Systems
- By Application
- Oncology
- Infectious Diseases
- Cardiovascular Disorders
- Diabetes
- Pulmonary Disorders
- Other Applications
- By Route of Administration
- Injectable
- Oral
- Nasal
- Transdermal / Topical
- Other Routes
- By End User
- Biopharma & Gene-therapy Developers
- Contract Manufacturing & CDMOs
- Academic & Research Institutes
- Hospitals & Specialty Clinics
- By Geography
- North America
- United States
- Canada
- Mexico
- Europe
- Germany
- United Kingdom
- France
- Italy
- Spain
- Rest of Europe
- Asia-Pacific
- China
- Japan
- India
- Australia
- South Korea
- Rest of Asia-Pacific
- Middle East & Africa
- GCC
- South Africa
- Rest of Middle East & Africa
- South America
- Brazil
- Argentina
- Rest of South America
- North America
Geography Analysis
North America led with 43.21% market share in 2025, backed by 12 FDA approvals in 2024 alone, deep venture capital pools, and cluster-based talent. Capacity additions like GenScript's USD 224 million ProBio plant in New Jersey and Fujifilm Diosynth's USD 1.2 billion North Carolina site underpin domestic manufacturing resilience. Europe follows with strong EMA oversight; Lonza's Geleen facility supplies global CASGEVY demand, and 88% of approved ATMPs operate under additional monitoring, ensuring post-marketing safety.
Asia-Pacific posts the highest 13.46% CAGR to 2031 as Samsung Biologics invests USD 1.46 billion for 784,000 L of vector capacity and China's biopharmaceutical sales could top 1.4 trillion yuan by 2029. Regulatory harmonization and local investment incentives attract multinational trials while fostering indigenous innovation.
Middle East & Africa and South America remain under-penetrated yet promising as vector costs fall and technology transfers expand. Only 5 of 32 approved therapies are currently accessible in LMICs, underscoring a need for collaborative financing and localized manufacturing to broaden treatment equity.
- Pfizer
- Novartis
- Roche
- Bayer
- Amgen
- Takara Bio
- Beckton Dickinson
- Thermo Fisher Scientific
- Lonza Group
- Catalent
- SIRION Biotech
- Genscript
- Genezen LLC
- Oxford Biomedica plc
- uniQure N.V.
- 4D Molecular Therapeutics
- Sarepta Therapeutics
- Spark Therapeutics
Additional Benefits:
- The market estimate (ME) sheet in Excel format
- 3 months of analyst support
TABLE OF CONTENTS
1 Introduction
- 1.1 Study Assumptions & Market Definition
- 1.2 Scope of the Study
2 Research Methodology
3 Executive Summary
4 Market Landscape
- 4.1 Market Overview
- 4.2 Market Drivers
- 4.2.1 Growing Burden Of Chronic & Lifestyle Diseases
- 4.2.2 Rapid R&D Advances By Biopharma Companies
- 4.2.3 Rising Approvals Of Vector-Based Gene Therapies
- 4.2.4 Surge In Venture & Strategic Funding Inflows
- 4.2.5 Ai-Driven Vector Design & Screening Tools
- 4.2.6 Regional Cdmo Build-Out Of Plasmid Capacity
- 4.3 Market Restraints
- 4.3.1 High Treatment & Reimbursement Costs
- 4.3.2 Safety / Immune-Response Concerns For Viral Vectors
- 4.3.3 Complex Multi-Jurisdiction Regulatory Pathways
- 4.3.4 Scarcity Of GMP-Grade Plasmid Manufacturing Slots
- 4.4 Value / Supply-Chain Analysis
- 4.5 Regulatory Landscape
- 4.6 Technological Outlook
- 4.7 Porter's Five Forces Analysis
- 4.7.1 Threat of New Entrants
- 4.7.2 Bargaining Power of Buyers
- 4.7.3 Bargaining Power of Suppliers
- 4.7.4 Threat of Substitutes
- 4.7.5 Intensity of Competitive Rivalry
5 Market Size & Growth Forecasts (Value)
- 5.1 By Delivery Systems
- 5.1.1 Viral Gene Delivery Systems
- 5.1.1.1 Adenoviral Vectors
- 5.1.1.2 Lentiviral Vectors
- 5.1.1.3 Retroviral Vectors
- 5.1.1.4 Other Viral Vectors (AAV, HSV, etc.)
- 5.1.2 Non-viral Gene Delivery
- 5.1.3 Combined / Hybrid Delivery Systems
- 5.1.1 Viral Gene Delivery Systems
- 5.2 By Application
- 5.2.1 Oncology
- 5.2.2 Infectious Diseases
- 5.2.3 Cardiovascular Disorders
- 5.2.4 Diabetes
- 5.2.5 Pulmonary Disorders
- 5.2.6 Other Applications
- 5.3 By Route of Administration
- 5.3.1 Injectable
- 5.3.2 Oral
- 5.3.3 Nasal
- 5.3.4 Transdermal / Topical
- 5.3.5 Other Routes
- 5.4 By End User
- 5.4.1 Biopharma & Gene-therapy Developers
- 5.4.2 Contract Manufacturing & CDMOs
- 5.4.3 Academic & Research Institutes
- 5.4.4 Hospitals & Specialty Clinics
- 5.5 By Geography
- 5.5.1 North America
- 5.5.1.1 United States
- 5.5.1.2 Canada
- 5.5.1.3 Mexico
- 5.5.2 Europe
- 5.5.2.1 Germany
- 5.5.2.2 United Kingdom
- 5.5.2.3 France
- 5.5.2.4 Italy
- 5.5.2.5 Spain
- 5.5.2.6 Rest of Europe
- 5.5.3 Asia-Pacific
- 5.5.3.1 China
- 5.5.3.2 Japan
- 5.5.3.3 India
- 5.5.3.4 Australia
- 5.5.3.5 South Korea
- 5.5.3.6 Rest of Asia-Pacific
- 5.5.4 Middle East & Africa
- 5.5.4.1 GCC
- 5.5.4.2 South Africa
- 5.5.4.3 Rest of Middle East & Africa
- 5.5.5 South America
- 5.5.5.1 Brazil
- 5.5.5.2 Argentina
- 5.5.5.3 Rest of South America
- 5.5.1 North America
6 Competitive Landscape
- 6.1 Market Concentration
- 6.2 Market Share Analysis
- 6.3 Company Profiles (includes Global level Overview, Market level overview, Core Segments, Financials as available, Strategic Information, Market Rank/Share, Products & Services, Recent Developments)
- 6.3.1 Pfizer Inc.
- 6.3.2 Novartis AG
- 6.3.3 F. Hoffmann-La Roche AG
- 6.3.4 Bayer AG
- 6.3.5 Amgen Inc.
- 6.3.6 Takara Bio Inc.
- 6.3.7 Becton, Dickinson & Company
- 6.3.8 Thermo Fisher Scientific Inc.
- 6.3.9 Lonza Group AG
- 6.3.10 Catalent Inc.
- 6.3.11 Sirion-Biotech GmbH
- 6.3.12 GenScript ProBio
- 6.3.13 Genezen LLC
- 6.3.14 Oxford Biomedica plc
- 6.3.15 uniQure N.V.
- 6.3.16 4D Molecular Therapeutics
- 6.3.17 Sarepta Therapeutics
- 6.3.18 Spark Therapeutics
7 Market Opportunities & Future Outlook
- 7.1 White-space & Unmet-need Assessment

