PUBLISHER: Mordor Intelligence | PRODUCT CODE: 2114859

PUBLISHER: Mordor Intelligence | PRODUCT CODE: 2114859
United States Amusement And Theme Park Industry - Market Share Analysis, Industry Trends & Statistics, Growth Forecasts (2026 - 2031)
Theme parks held 51.24% in 2025, reflecting the largest slice of the format mix in the United States amusement and theme park market. Destination parks combine hotels, premium dining, and proprietary IP to justify multi-day visits and maintain a steady cadence of capital refresh. In the same period, indoor entertainment centers posted the fastest trajectory, with a 6.36% forecast CAGR through 2031, which aligns with the shift to shorter outings clustered around suburban mixed-use nodes.
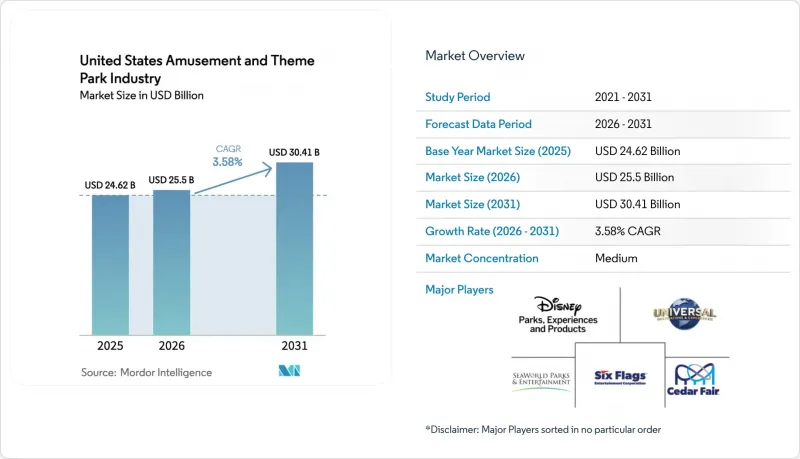
According to Mordor Intelligence, the United States amusement and theme park industry size was valued at USD 24.62 billion in 2025 and is estimated to grow from USD 25.5 billion in 2026 to reach USD 30.41 billion by 2031, at a CAGR of 3.58% during the forecast period (2026-2031). This report is Segmented by Park Type (Theme Parks, Water Parks, Adventure Parks/Thrill Parks, and More), Ride Type (Land Rides, Water Rides, Hybrid/Dark Rides, and Other Rides), Source of Revenue (Tickets, Food & Beverages, Merchandise, and More), and Geography (Northeast, Southeast, Southwest, West, and Midwest). The Market Forecasts are Provided in Terms of Value (USD).
United States Amusement And Theme Park Industry Trends and Insights
Growth in Consumer Spending & Disposable Income
Central Florida recorded USD 59.9 billion in direct visitor spending in 2024, with 75.3 million visitors supporting the region's role as the core United States destination for theme and resort stays. The Walt Disney Company reported higher per capita guest spending at domestic parks in fiscal 2024 as pricing and product mix offset flat-to-slightly lower attendance . United Parks & Resorts posted a record in-park per capita spending of USD 36.46 and continued to demonstrate pricing power despite weather disruptions during peak periods. In contrast, the combined Six Flags entity recorded a 9% attendance decline versus the prior-year combined baseline during Q2 2025, which reflected weather and pricing sensitivities among value-oriented day guests. International inbound travel adds incremental upside, with United States arrivals projected to surpass pre-2020 levels in 2026 and amusement parks capturing a substantial share of overseas visitor itineraries.
Surge in Season-Pass and Subscription Program Adoption Stabilizing Year-Round Gate Traffic
The combined Six Flags Entertainment Corporation reported an active pass base of 6.7 million units as of mid-2025, which anchors recurring revenue and helps smooth attendance variability within the United States amusement and theme park market. Portfolio integration following the 2024 merger created cross-park benefits and supports the rollout of standardized premium add-ons that lift per-passholder spend over time within the United States amusement and theme park market. United Parks & Resorts noted strong forward-booking trends heading into 2026 for Discovery Cove and group sales, signaling a sustained commitment to advance-purchase products through changing weather and macro conditions . Season passholders visit more often than single-ticket guests and support predictable cash flow and higher lifetime value when bundled with food and line-skipping programs, which operators scale across larger networks. The strategic risk is over-discounting that habituates consumers to lower thresholds, a dynamic that appears in periods of weak weather and tighter household budgets and is closely managed through data-driven revenue optimization.
Rising Wage Inflation and Persistent Frontline Labor Shortages Escalating Operating Costs
Domestic parks incurred higher operating labor expenses in fiscal 2025 due to inflation and staffing needs around new attractions, which pressured segment income even as revenue expanded. United Parks & Resorts highlighted wage inflation and benefit costs among its forward-looking risk factors, underscoring the persistence of cost pressures across key markets within the United States amusement and theme park market. Regional parks feel these increases more acutely because they lack resort lodging to diversify revenue and cannot always pass higher costs through gate pricing without suppressing demand. Operators continue to test self-service ordering, mobile pickup, and targeted staffing across peak windows to maintain service levels with fewer hours per transaction. The net effect is a search for automation that improves throughput while preserving guest satisfaction in the United States amusement and theme park market.
Other drivers and restraints analyzed in the detailed report include:
- Flagship IP Integrations Widening Demographic Appeal and Boosting Per-Capita Spend
- Record Pipeline of New High-Thrill Coaster Installations (2024-2026) Driving First-Time and Repeat Visitation
- Escalating Cap-Ex Requirements for Ride Refurbishment and ASTM or OSHA Safety Compliance
For complete list of drivers and restraints, kindly check the Table Of Contents.
Segment Analysis
The United States amusement and theme park market benefits when compact indoor venues draw local families for two to three hours and then connect foot traffic to adjacent retail. Weather insulation and smaller footprint economics make indoor venues attractive for developers, while their digital-first operations simplify pricing, redemption, and loyalty.
Indoor growth does not diminish the role of destination parks in the United States amusement and theme park market. The flow of inbound visitors and a broad on-site product stack keep destination parks central to family travel plans. Water parks and animal or marine parks add variety but rely on careful event and holiday programming to sustain repeat local visits. The Themed Entertainment Association recorded changes across top properties and confirmed that attraction mix and storytelling drive repeat intent as much as raw ride scale. The United States amusement and theme park market size spans both destination and neighborhood formats as households balance budget, time, and novelty needs across the year.
Complete Report Scope:
- By Park Type
- Theme Parks
- Water Parks
- Adventure Parks / Thrill Parks
- Animal & Marine Parks
- Indoor Entertainment Centers
- By Ride Type
- Land Rides
- Water Rides
- Hybrid / Dark Rides
- Other Rides
- By Source of Revenue
- Tickets
- Food & Beverages
- Merchandise
- Hospitality (Lodging & Events)
- Ancillary Services (Parking, Photos, Fast-Pass, etc.)
- By Region
- Northeast
- Southeast
- Southwest
- West
- Midwest
List of Companies Covered in this Report:
- Disney Parks, Experiences and Products
- Universal Destinations & Experiences
- Six Flags Entertainment Corporation
- Cedar Fair L.P.
- SeaWorld Parks & Entertainment, Inc.
- Herschend Family Entertainment Corporation
- Merlin Entertainments Group
- Hershey Entertainment & Resorts Company
- Parques Reunidos Servicios Centrales S.A.
- Palace Entertainment
- Great Wolf Resorts, Inc.
- Schlitterbahn Waterparks and Resorts
- Premier Parks, LLC
- Lagoon Amusement Park, Inc.
- Koch Family Parks (Holiday World & Splashin' Safari)
- Adventureland Resort (Adventure Lands of America)
- Glenwood Caverns Adventure Park
- ICON Park Orlando (Unicorp National Developments)
- Fun Spot America Theme Parks
- Nickelodeon Universe (Triple Five Group)
Additional Benefits:
- The market estimate (ME) sheet in Excel format
- 3 months of analyst support
TABLE OF CONTENTS
1 Introduction
- 1.1 Study Assumptions & Market Definition
- 1.2 Scope of the Study
2 Research Methodology
3 Executive Summary
4 Market Landscape
- 4.1 Market Overview
- 4.2 Market Drivers
- 4.2.1 Growth in Consumer Spending & Disposable Income
- 4.2.2 Surge in season-pass and subscription program adoption stabilising year-round gate traffic
- 4.2.3 Flagship IP integrations widening demographic appeal and boosting per-capita spend
- 4.2.4 Record pipeline of new high-thrill coaster installations (2024-2026) driving first-time and repeat visitation
- 4.2.5 Resort-style park expansions capturing multi-day guest spend
- 4.2.6 Increase in Domestic and International Tourism
- 4.3 Market Restraints
- 4.3.1 Rising wage inflation and persistent frontline labour shortages escalating operating costs
- 4.3.2 Escalating cap-ex requirements for ride refurbishment and ASTM/OSHA safety compliance
- 4.3.3 Ticket-price growth outpacing CPI, limiting accessibility for middle-income families
- 4.3.4 Increasing frequency of weather-related closures disrupting peak-season operations
- 4.4 Value / Supply-Chain Analysis
- 4.5 Regulatory Outlook
- 4.6 Technological Outlook
- 4.6.1 Virtual-queue & dynamic-pricing platforms
- 4.6.2 Immersive XR ride systems & show control tech
- 4.6.3 AI-driven guest-flow analytics and personalization
- 4.7 Porter's Five Forces Analysis
- 4.7.1 Bargaining Power of Suppliers
- 4.7.2 Bargaining Power of Buyers/Consumers
- 4.7.3 Threat of New Entrants
- 4.7.4 Threat of Substitutes
- 4.7.5 Intensity of Competitive Rivalry
- 4.8 Insights on Revenue Flows from Accommodation & F&B
5 Market Size & Growth Forecasts (Value, USD)
- 5.1 By Park Type
- 5.1.1 Theme Parks
- 5.1.2 Water Parks
- 5.1.3 Adventure Parks / Thrill Parks
- 5.1.4 Animal & Marine Parks
- 5.1.5 Indoor Entertainment Centers
- 5.2 By Ride Type
- 5.2.1 Land Rides
- 5.2.2 Water Rides
- 5.2.3 Hybrid / Dark Rides
- 5.2.4 Other Rides
- 5.3 By Source of Revenue
- 5.3.1 Tickets
- 5.3.2 Food & Beverages
- 5.3.3 Merchandise
- 5.3.4 Hospitality (Lodging & Events)
- 5.3.5 Ancillary Services (Parking, Photos, Fast-Pass, etc.)
- 5.4 By Region
- 5.4.1 Northeast
- 5.4.2 Southeast
- 5.4.3 Southwest
- 5.4.4 West
- 5.4.5 Midwest
6 Competitive Landscape
- 6.1 Market Concentration
- 6.2 Strategic Moves
- 6.3 Market Share Analysis
- 6.4 Company Profiles (includes Global-level Overview, Market-level Overview, Core Segments, Financials as available, Strategic Information, Market Rank/Share, Products & Services, Recent Developments)
- 6.4.1 Disney Parks, Experiences and Products
- 6.4.2 Universal Destinations & Experiences
- 6.4.3 Six Flags Entertainment Corporation
- 6.4.4 Cedar Fair L.P.
- 6.4.5 SeaWorld Parks & Entertainment, Inc.
- 6.4.6 Herschend Family Entertainment Corporation
- 6.4.7 Merlin Entertainments Group
- 6.4.8 Hershey Entertainment & Resorts Company
- 6.4.9 Parques Reunidos Servicios Centrales S.A.
- 6.4.10 Palace Entertainment
- 6.4.11 Great Wolf Resorts, Inc.
- 6.4.12 Schlitterbahn Waterparks and Resorts
- 6.4.13 Premier Parks, LLC
- 6.4.14 Lagoon Amusement Park, Inc.
- 6.4.15 Koch Family Parks (Holiday World & Splashin' Safari)
- 6.4.16 Adventureland Resort (Adventure Lands of America)
- 6.4.17 Glenwood Caverns Adventure Park
- 6.4.18 ICON Park Orlando (Unicorp National Developments)
- 6.4.19 Fun Spot America Theme Parks
- 6.4.20 Nickelodeon Universe (Triple Five Group)
7 Market Opportunities & Future Outlook
- 7.1 White-space & Unmet-Need Assessment

