PUBLISHER: Mordor Intelligence | PRODUCT CODE: 2114933

PUBLISHER: Mordor Intelligence | PRODUCT CODE: 2114933
Polyurethane Composites - Market Share Analysis, Industry Trends & Statistics, Growth Forecasts (2026 - 2031)
According to Mordor Intelligence, polyurethane composites market size market size in 2026 is estimated at USD 0.91 billion, growing from 2025 value of USD 0.86 billion with 2031 projections showing USD 1.17 billion, growing at 5.33% CAGR over 2026-2031.
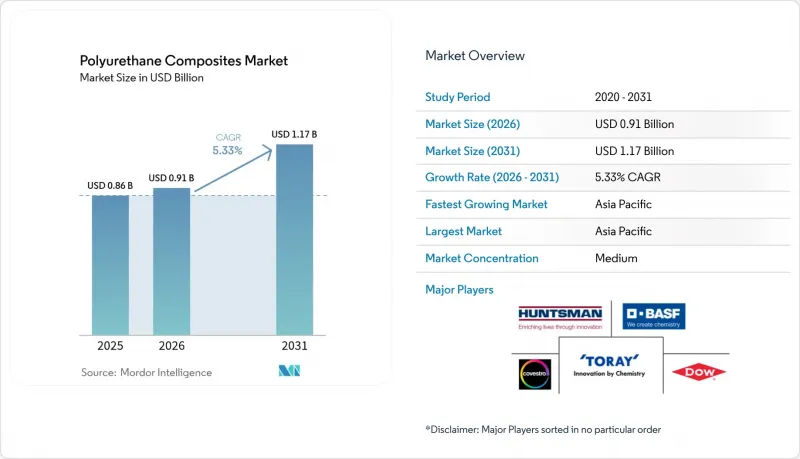
This report is Segmented by Fiber Type (Glass, Carbon, Others), Resin Type (Thermoset PU, Thermoplastic PU, Bio-Based PU), End-User Industry (Transportation, Building and Construction, Electrical and Electronics, Wind Energy, Sports and Recreation, Others), and Geography (North America, South America, Europe, Asia-Pacific, and Middle-East and Africa). The Market Forecasts are Provided in Terms of Value (USD).
Global Polyurethane Composites Market Trends and Insights
Lightweighting Push in Transportation
Automotive, rail, and aerospace manufacturers are integrating polyurethane composites to comply with stringent efficiency rules and range expectations. Ford's composite C-brace on the Bronco Raptor illustrates how weight reduction can be paired with noise and vibration dampening to improve ride comfort. Railcar builders also fit polyurethane glazing and sound-barrier components to meet stricter cabin-noise limits. Growing electric-vehicle production magnifies material substitution because battery packs impose a significant mass penalty that composite body structures can offset.
Rapid Wind-Turbine Blade Length Scaling
Longer blades raise megawatt output and cut the levelized cost of energy, driving demand for stiffer and lighter spar caps made with polyurethane and carbon fiber. Vestas validated Dow's polyurethane-carbon spar technology, opening a pathway for blades that exceed 100 m without process slowdowns typical of epoxy curing. The US Department of Energy's Big Adaptive Rotor program further highlights logistics bottlenecks that favor faster-curing polyurethane infusion routes.
Automotive Production Volatility
Fluctuating vehicle output is disrupting supply-chain planning for resin suppliers and molders. Covestro's 2023 sales slipped 20% to EUR 14.4 billion as lower automotive demand translated into weaker order volumes. SGL Carbon reported revenue pressure when long-running composite contracts expired ahead of replacement programs. The pivot to electric vehicles adds forecasting uncertainty because legacy internal-combustion platforms and next-generation EV architectures call for different material sets.
Other drivers and restraints analyzed in the detailed report include:
- Construction Shift to Modular PU-SIPs Panels
- ESG-Driven Bio-Based PU Resin Adoption
- High Carbon/PU Composite Fabrication Costs
For complete list of drivers and restraints, kindly check the Table Of Contents.
Segment Analysis
Glass fiber held 59.12% of revenue in 2025 on the strength of mature supply lines and cost efficiency across automotive, construction, and marine applications. Carbon fiber is set to grow at 6.21% CAGR, outpacing the overall polyurethane composites market as aerospace rebound and wind blade scaling raise demand for superior stiffness-to-weight ratios. The polyurethane composites market size for carbon fiber applications is projected to widen substantially as Vestas adopts Dow's spar cap technology in next-generation turbines.
The scale advantages of glass fiber should keep it entrenched in cost-sensitive transportation and building parts even as carbon solutions penetrate premium segments. Manufacturers are exploring Surface-Modified roving to enhance adhesion with non-isocyanate resins, which could sustain glass volumes despite tightening VOC rules.
Complete Report Scope:
- By Fiber Type
- Glass
- Carbon
- Others
- By Resin Type
- Thermoset PU
- Thermoplastic PU
- Bio-based PU
- By End-User Industry
- Transportation
- Building and Construction
- Electrical and Electronics
- Wind Energy
- Sports and Recreation
- Others
- By Geography
- Asia-Pacific
- China
- India
- Japan
- South Korea
- Rest of Asia-Pacifc
- North America
- United States
- Canada
- Mexico
- Europe
- Germany
- United Kingdom
- France
- Italy
- Rest of Europe
- South America
- Brazil
- Argentina
- Rest of South America
- Middle-East and Africa
- Saudi Arabia
- South Africa
- Rest of Middle-East and Africa
- Asia-Pacific
Geography Analysis
Asia Pacific dominated the polyurethane composites market with 52.30% of global revenue in 2025 and is expected to climb at a 7.25% CAGR through 2031. China and India drive volumes through automotive assembly expansion and wind farm construction, while Southeast Asia boosts propylene glycol and specialty amine capacities to feed resin plants.
North America retains a substantial footprint due to aerospace, defense, and high-value automotive programs. Policy incentives for clean energy projects spur additional wind blade and battery-component fabrication across the United States. Europe's trajectory is shaped by rigorous chemical regulations and aggressive renewable-energy targets. REACH restrictions on diisocyanates are pushing formulators to low-monomer and bio-derived routes, streamlining a green transition that amplifies polyurethane composite usage in circular applications
- AOC Resins
- BASF
- Covestro AG
- Dow
- Evonik Industries AG
- Gurit Holding
- Henkel AG & Co. KGaA
- Hexcel Corporation
- Huntsman International LLC
- Linecross Ltd.
- LyondellBasell Industries Holdings B.V.
- Mitsui Chemicals Inc
- Owens Corning
- SABIC
- SGL Carbon
- Solvay
- Teijin Limited
- The Lubrizol Corporation
- TORAY INDUSTRIES, INC.
- Webasto Group
Additional Benefits:
- The market estimate (ME) sheet in Excel format
- 3 months of analyst support
TABLE OF CONTENTS
1 Introduction
- 1.1 Study Assumptions and Market Definition
- 1.2 Scope of the Study
2 Research Methodology
3 Executive Summary
4 Market Landscape
- 4.1 Market Overview
- 4.2 Market Drivers
- 4.2.1 Lightweighting Push in Transportation
- 4.2.2 Rapid Wind-Turbine Blade Length Scaling
- 4.2.3 Construction Shift to Modular PU-Sips Panels
- 4.2.4 ESG-Driven Bio-Based PU Resin Adoption
- 4.2.5 Thermal-Protective Polyurethane Battery Enclosures
- 4.3 Market Restraints
- 4.3.1 Automotive Production Volatility
- 4.3.2 High Carbon/PU Composite Fabrication Costs
- 4.3.3 Chlorine Feedstock Regulatory Risk (MDI/TDI)
- 4.4 Value Chain Analysis
- 4.5 Porter's Five Forces
- 4.5.1 Bargaining Power of Suppliers
- 4.5.2 Bargaining Power of Buyers
- 4.5.3 Threat of New Entrants
- 4.5.4 Threat of Substitutes
- 4.5.5 Degree of Competition
5 Market Size and Growth Forecasts (Value)
- 5.1 By Fiber Type
- 5.1.1 Glass
- 5.1.2 Carbon
- 5.1.3 Others
- 5.2 By Resin Type
- 5.2.1 Thermoset PU
- 5.2.2 Thermoplastic PU
- 5.2.3 Bio-based PU
- 5.3 By End-User Industry
- 5.3.1 Transportation
- 5.3.2 Building and Construction
- 5.3.3 Electrical and Electronics
- 5.3.4 Wind Energy
- 5.3.5 Sports and Recreation
- 5.3.6 Others
- 5.4 By Geography
- 5.4.1 Asia-Pacific
- 5.4.1.1 China
- 5.4.1.2 India
- 5.4.1.3 Japan
- 5.4.1.4 South Korea
- 5.4.1.5 Rest of Asia-Pacifc
- 5.4.2 North America
- 5.4.2.1 United States
- 5.4.2.2 Canada
- 5.4.2.3 Mexico
- 5.4.3 Europe
- 5.4.3.1 Germany
- 5.4.3.2 United Kingdom
- 5.4.3.3 France
- 5.4.3.4 Italy
- 5.4.3.5 Rest of Europe
- 5.4.4 South America
- 5.4.4.1 Brazil
- 5.4.4.2 Argentina
- 5.4.4.3 Rest of South America
- 5.4.5 Middle-East and Africa
- 5.4.5.1 Saudi Arabia
- 5.4.5.2 South Africa
- 5.4.5.3 Rest of Middle-East and Africa
- 5.4.1 Asia-Pacific
6 Competitive Landscape
- 6.1 Market Concentration
- 6.2 Strategic Moves
- 6.3 Market Share Analysis
- 6.4 Company Profiles (includes Global level Overview, Market level overview, Core Segments, Financials as available, Strategic Information, Market Rank/Share for key companies, Products and Services, and Recent Developments)
- 6.4.1 AOC Resins
- 6.4.2 BASF
- 6.4.3 Covestro AG
- 6.4.4 Dow
- 6.4.5 Evonik Industries AG
- 6.4.6 Gurit Holding
- 6.4.7 Henkel AG & Co. KGaA
- 6.4.8 Hexcel Corporation
- 6.4.9 Huntsman International LLC
- 6.4.10 Linecross Ltd.
- 6.4.11 LyondellBasell Industries Holdings B.V.
- 6.4.12 Mitsui Chemicals Inc
- 6.4.13 Owens Corning
- 6.4.14 SABIC
- 6.4.15 SGL Carbon
- 6.4.16 Solvay
- 6.4.17 Teijin Limited
- 6.4.18 The Lubrizol Corporation
- 6.4.19 TORAY INDUSTRIES, INC.
- 6.4.20 Webasto Group
7 Market Opportunities and Future Outlook
- 7.1 White-space and Unmet-Need Assessment

