PUBLISHER: Mordor Intelligence | PRODUCT CODE: 2114972

PUBLISHER: Mordor Intelligence | PRODUCT CODE: 2114972
Potassium Permanganate - Market Share Analysis, Industry Trends & Statistics, Growth Forecasts (2026 - 2031)
According to Mordor Intelligence, the potassium permanganate market size is expected to increase from USD 0.93 billion in 2025 to USD 0.97 billion in 2026 and reach USD 1.19 billion by 2031, growing at a CAGR of 4.11% over 2026-2031.
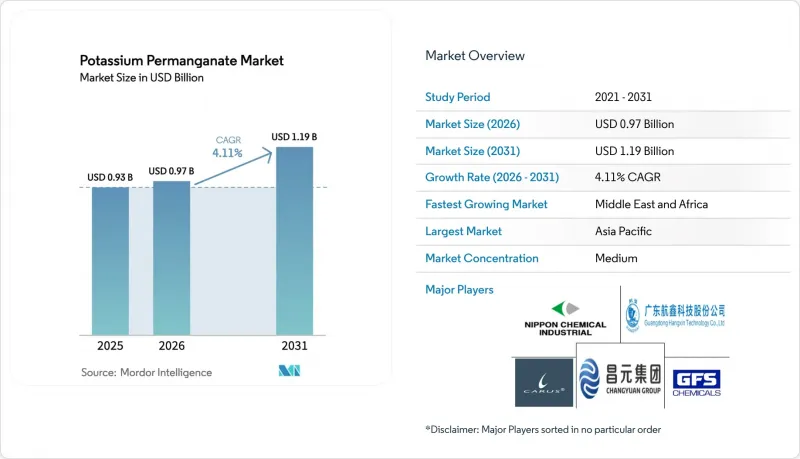
This report is Segmented by Form (Crystalline Solids, Powders, and Aqueous Solutions), End-User Industry (Chemical and Petrochemicals, Paper and Pulp, Mining, Power Generation, Oil and Gas, Food and Beverage Processing, and Others), and Geography (Asia-Pacific, North America, Europe, South America, and Middle-East and Africa). The Market Forecasts are Provided in Terms of Value (USD).
Global Potassium Permanganate Market Trends and Insights
Growing Need for High-Quality Water Treatment
Water-scarce regions have tightened dissolved manganese limits to 0.05 mg/L, and utilities now prefer permanganate over chlorine because it oxidizes metals without producing trihalomethanes. Desalination complexes in the United Arab Emirates dose 2-4 mg/L upstream of reverse-osmosis membranes, preventing biofouling and extending membrane life, which offsets chemical costs that average USD 300 per metric ton. The country's 1,585 MIGD installed desalination capacity translates to more than 2,400 metric tons of annual demand, and national targets for 95% wastewater reuse will deepen consumption. Certification under NSF/ANSI 60 ensures only qualified formulations enter municipal pipelines, which limits supplier churn and favors incumbents that maintain audited production records.
Expanding Pharmaceutical Synthesis Applications
Manufacturers have shifted from chromium-based oxidants toward permanganate to avoid heavy-metal disposal liabilities. A 2% increase in oxidation selectivity saves about USD 0.5 million annually for a 100-metric-ton API line, making process economics compelling even at higher oxidizer prices. FDA rules under 21 CFR 250.108 restrict crystal sales to prescription status, yet dilute solutions below 0.04% remain available for topical antiseptics, a category that expanded during pandemic shortages of alcohol disinfectants. India's export strategy includes REACH-compliant inorganic oxidizers, positioning local suppliers to win European orders as global majors rationalize their vendor lists.
Health and Dermal Toxicity Concerns
Occupational-safety rules require gloves, face shields, and spill-containment systems when permanganate concentration exceeds 0.04%, adding up to USD 15,000 in annual compliance costs for a mid-size water plant. WHO reports cited genotoxic effects in rodents, raising caution even though no guideline revision followed. Utilities therefore err on low dose rates, sometimes compromising oxidation effectiveness.
Other drivers and restraints analyzed in the detailed report include:
- Rapid Industrial Adoption in Aquaculture Biosecurity
- Emerging Demand for Permanganate-Based Battery Electrolyte Additives
- Availability of Benign Competing Oxidizers
For complete list of drivers and restraints, kindly check the Table Of Contents.
Segment Analysis
Crystalline solids held 48.37% of Potassium Permanganate Market market share in 2025 on the strength of two-year shelf stability and lower freight cost per active kilogram. Utilities in India and sub-Saharan Africa rely on gravity dissolving tanks that suit bagged material, while aquaculture farms dissolve crystals pond-side to match parasite cycles. The shift toward automated dosing in Gulf desalination plants, however, favors liquid formats because workers avoid dust exposure and exothermic reactions. A single 100 MIGD desalination unit in the United Arab Emirates consumes roughly 300 metric tons annually, and bulk liquid delivery in intermediate bulk containers streamlines logistics in 45 °C heat. Chemical plants also prefer solutions that feed closed-loop oxidation tanks through PLC-controlled pumps, enabling tighter dose control and reducing manganese-sludge disposal.
Aqueous solutions are projected to grow at a 5.64% CAGR, making them the fastest form category through 2031. Real-time spectrophotometric sensors detect 0.45 µM permanganate in process streams, which allows operators to optimize dosing continuously and cut over-feed costs. Powders, while more soluble than crystals, face corrosion issues in long-term storage yet still find use in mining sites that value rapid dissolution for in-situ chemical oxidation. As a result, the Potassium Permanganate Market market continues to diversify across form factors, and suppliers that offer multi-format portfolios capture cross-selling opportunities when customers upgrade dosing infrastructure.
Complete Report Scope:
- By Form
- Crystalline Solids
- Powders
- Aqueous Solutions
- By End-user Industry
- Chemical and Petrochemicals Industry
- Paper and Pulp
- Mining
- Power Generation
- Oil and Gas
- Food and Beverage Processing Industry
- Other End-User Industries
- By Geography
- Asia-Pacific
- China
- India
- Japan
- South Korea
- ASEAN Countries
- Rest of Asia-Pacific
- North America
- United States
- Canada
- Mexico
- Europe
- Germany
- United Kingdom
- France
- Italy
- NORDIC Countries
- Rest of Europe
- South America
- Brazil
- Argentina
- Rest of South America
- Middle-East and Africa
- South Africa
- Saudi Arabia
- Rest of Middle-East and Africa
- Asia-Pacific
Geography Analysis
Asia-Pacific generated 46.28% of Potassium Permanganate Market market revenue in 2025, anchored by China's export-oriented supply base. Chongqing Changyuan Group operates vertically integrated sites in Rongchang and Baiyin that claim 60% of global output and 90% of Chinese exports. India became the primary supplier to North America after the 2023 Carus outage, shipping 161 metric tons in January 2025 alone. Japan and South Korea use permanganate in pharmaceutical syntheses and ultrapure water plants for semiconductor fabs, while Australia deploys it in municipal water and salmon aquaculture.
The Middle-East and Africa region is forecast to post the swiftest growth at 5.43% CAGR. Gulf Cooperation Council utilities dose permanganate throughout desalination pretreatment and wastewater recycling to hit national water-security targets, and South African mines oxidize acid-mine drainage before discharge to the Vaal River. Saudi petrochemical complexes in Jubail and Yanbu employ permanganate to control cooling-water biofilms and reduce hydrogen sulfide emissions, aligning with Royal Commission discharge standards.
In North America, the Carus fire demonstrated regional supply fragility, prompting utilities to diversify sources and test sodium permanganate as an immediate substitute. Canada's largest volumes come from Great Lakes surface-water plants that mitigate taste and odor, whereas Mexican demand is split between mining in Sonora and municipal upgrades supported by USMCA funds. Europe shows modest growth as chlorine dioxide dominates large plants, yet brownfield remediation projects in Germany and the Netherlands continue to specify permanganate for in-situ chemical oxidation of chlorinated solvent plumes. South America's consumption is tied to Chilean salmon farms and Brazilian tilapia ponds that demand biosecure oxidants, while Argentine wineries sanitize barrels with permanganate to avoid sulfur residues.
- Carus Group Inc.
- Changsha Yonta
- Chongqing Changyuan Group Limited
- GFS Chemicals, Inc.
- Hangxin Technology
- Hebei Huiyang Chemical
- Hubei Xiangyun (Group) Chemical Co., Ltd.
- Libox Chem (India) Pvt. Ltd.
- Magnesia GmbH
- Milport Enterprises, Inc.
- Mubychem Group
- Nippon Chemical Industrial CO., LTD.
- Otto Chemie Pvt. Ltd.
- Rusan Pharma
- Seidler Chemical Co.
- Univar Solutions Inc,
- Universal Chemicals & Industries Pvt. Ltd.
Additional Benefits:
- The market estimate (ME) sheet in Excel format
- 3 months of analyst support
TABLE OF CONTENTS
1 Introduction
- 1.1 Study Assumptions and Market Definition
- 1.2 Scope of the Study
2 Research Methodology
3 Executive Summary
4 Market Landscape
- 4.1 Market Overview
- 4.2 Market Drivers
- 4.2.1 Growing Need for High-Quality Water Treatment
- 4.2.2 Expanding Pharmaceutical Synthesis Applications
- 4.2.3 Rapid Industrial Adoption in Aquaculture Bio-Security
- 4.2.4 Emerging Demand for Permanganate-Based Battery Electrolyte Additives
- 4.2.5 Advanced Odor-Control Solutions in Industrial Wastewater
- 4.3 Market Restraints
- 4.3.1 Health and Dermal-Toxicity Concerns
- 4.3.2 Availability of Benign Competing Oxidizers (e.g., Sodium Hypochlorite)
- 4.3.3 Volatile Supply of High-Grade Mno2 Feedstock
- 4.4 Value Chain Analysis
- 4.5 Porter's Five Forces
- 4.5.1 Bargaining Power of Suppliers
- 4.5.2 Bargaining Power of Buyers
- 4.5.3 Threat of New Entrants
- 4.5.4 Threat of Substitutes
- 4.5.5 Degree of Competition
5 Market Size and Growth Forecasts (Value)
- 5.1 By Form
- 5.1.1 Crystalline Solids
- 5.1.2 Powders
- 5.1.3 Aqueous Solutions
- 5.2 By End-user Industry
- 5.2.1 Chemical and Petrochemicals Industry
- 5.2.2 Paper and Pulp
- 5.2.3 Mining
- 5.2.4 Power Generation
- 5.2.5 Oil and Gas
- 5.2.6 Food and Beverage Processing Industry
- 5.2.7 Other End-User Industries
- 5.3 By Geography
- 5.3.1 Asia-Pacific
- 5.3.1.1 China
- 5.3.1.2 India
- 5.3.1.3 Japan
- 5.3.1.4 South Korea
- 5.3.1.5 ASEAN Countries
- 5.3.1.6 Rest of Asia-Pacific
- 5.3.2 North America
- 5.3.2.1 United States
- 5.3.2.2 Canada
- 5.3.2.3 Mexico
- 5.3.3 Europe
- 5.3.3.1 Germany
- 5.3.3.2 United Kingdom
- 5.3.3.3 France
- 5.3.3.4 Italy
- 5.3.3.5 NORDIC Countries
- 5.3.3.6 Rest of Europe
- 5.3.4 South America
- 5.3.4.1 Brazil
- 5.3.4.2 Argentina
- 5.3.4.3 Rest of South America
- 5.3.5 Middle-East and Africa
- 5.3.5.1 South Africa
- 5.3.5.2 Saudi Arabia
- 5.3.5.3 Rest of Middle-East and Africa
- 5.3.1 Asia-Pacific
6 Competitive Landscape
- 6.1 Market Concentration
- 6.2 Strategic Moves
- 6.3 Market Share/Ranking Analysis
- 6.4 Company Profiles (includes Global level Overview, Market level overview, Core Segments, Financials, Strategic Information, Market Rank/Share, Products and Services, Recent Developments)
- 6.4.1 Carus Group Inc.
- 6.4.2 Changsha Yonta
- 6.4.3 Chongqing Changyuan Group Limited
- 6.4.4 GFS Chemicals, Inc.
- 6.4.5 Hangxin Technology
- 6.4.6 Hebei Huiyang Chemical
- 6.4.7 Hubei Xiangyun (Group) Chemical Co., Ltd.
- 6.4.8 Libox Chem (India) Pvt. Ltd.
- 6.4.9 Magnesia GmbH
- 6.4.10 Milport Enterprises, Inc.
- 6.4.11 Mubychem Group
- 6.4.12 Nippon Chemical Industrial CO., LTD.
- 6.4.13 Otto Chemie Pvt. Ltd.
- 6.4.14 Rusan Pharma
- 6.4.15 Seidler Chemical Co.
- 6.4.16 Univar Solutions Inc,
- 6.4.17 Universal Chemicals & Industries Pvt. Ltd.
7 Market Opportunities and Future Outlook
- 7.1 White-space and Unmet-Need Assessment

