PUBLISHER: Mordor Intelligence | PRODUCT CODE: 2114982

PUBLISHER: Mordor Intelligence | PRODUCT CODE: 2114982
Magnetic Materials - Market Share Analysis, Industry Trends & Statistics, Growth Forecasts (2026 - 2031)
According to Mordor Intelligence, the magnetic materials market size was valued at 31.26 Million tons in 2025 and is estimated to grow from 33.18 Million tons in 2026 to reach 44.68 Million tons by 2031, at a CAGR of 6.13% during the forecast period (2026-2031).
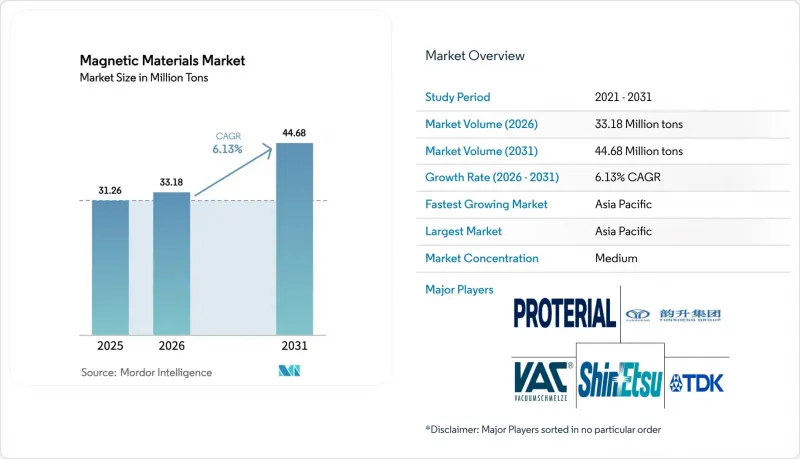
This report is Segmented by Material (Neodymium-Iron-Boron, Ferrite, and More), Type (Hard/Permanent Magnetic Materials, Soft Magnetic Materials, and Semi-Hard Magnetic Materials), Application (Motors and Generators, Transformers and Inductors, and More), End-User Industry (Electronics, Automotive, and More), and Geography (Asia-Pacific, North America, Europe, South America, and Middle-East and Africa).
Global Magnetic Materials Market Trends and Insights
Rising Electric Vehicle Adoption Fuels Demand for Magnetic Materials
Battery-electric vehicles consumed 2,800 tons of NdFeB magnets in 2024 and are projected to exceed 8,000 tons by 2030 as annual EV sales approach 30 million units. Permanent-magnet synchronous motors achieve peak efficiencies above 96%, prompting OEMs to spend on rare-earth grades to extend driving range without larger batteries. Tesla's 4680-cell design and BYD's Blade pack both use multi-motor layouts that double magnet content per vehicle versus single-motor cars. China built 9.5 million EVs in 2025, absorbing most domestic sintered-magnet output and tightening export supply. European platforms moving to 800-volt architectures require high-coercivity magnets able to withstand thermal demagnetization, which lifts dysprosium demand in the magnetic materials market.
Grid-Scale Wind-Turbine Gearless Generators Adoption
Direct-drive turbines remove gearboxes and cut mechanical losses by 2-3 percentage points, extending service intervals from six to eighteen months. Goldwind's 16 MW offshore unit contains about 12 tons of NdFeB, and 2026 offshore additions of 40 GW could draw roughly 30,000 tons of magnets. China supplies 60% of global turbines, so most magnet demand originates domestically even for projects installed abroad. Siemens Gamesa and Vestas trial recycled NdFeB, yet closed-loop material remains under 5% of consumption because reprocessing degrades flux up to 15%. North Sea operators now specify corrosion-resistant coatings that add USD 2-3 per kilogram but cut crane-vessel repair costs over 25-year lifecycles.
REE Mining ESG Backlash Intensifies in OECD Nations
Permitting for new rare-earth mines in the United States and Australia now averages 7-10 years, double the 2015 timeline, because regulators require perpetual tailings-water treatment bonds. Lynas paused its Kalgoorlie refinery expansion for 18 months while negotiating residue-disposal terms, proving even brownfield projects face social-license delays. Environmental groups have sued MP Materials over radionuclide discharge at Mountain Pass, elevating compliance costs in the magnetic materials market. The EU's Critical Raw Materials Act demands 10% local supply by 2030, yet no new European mine is online, forcing the bloc to rely on toll refining in Asia. These headwinds are nudging OEMs toward magnet-free motor designs that trade 3-5% efficiency for rare-earth independence when neodymium oxide tops USD 80/kg.
Other drivers and restraints analyzed in the detailed report include:
- AI-Enabled Factory Automation Boosts Sensor Magnets
- High-Frequency Power Electronics Need Nanocrystalline Cores
- China Export-Control Risk on Nd and Dy Oxides
For complete list of drivers and restraints, kindly check the Table Of Contents.
Segment Analysis
Neodymium-Iron-Boron (NdFeB) commanded 44.21% of 2025 volume, reflecting its unmatched energy product that lets motor makers halve rotor size without losing torque. That dominance locks in premium pricing, yet rising dysprosium cost keeps OEMs searching for alternatives in the magnetic materials market. Ferrite is slated to grow at a 6.28% CAGR through 2031 as handset makers replace bonded NdFeB with injection-molded ferrite in haptic and charging modules, trading 20% performance for zero rare-earth risk. Samarium-cobalt serves niche aerospace and downhole-tool markets above 200 °C, where NdFeB loses flux; volumes stay under 3,000 tons, but prices above USD 100/kg keep profitability intact. AlNiCo is useful mainly in legacy sensors and musical pickups, while electrical steel drives high demand thanks to transformers and motor laminations, anchoring the magnetic materials market. Premium nanocrystalline ribbons win high-frequency slots in data-center PSUs, a pocket of outsized margin amid commodity tonnage.
Soft magnetic materials held 61.23% tonnage in 2025, buoyed by transformer cores, inductors, and stator laminations that cycle magnetization thousands of times per second. Grain-oriented electrical steel is enjoying fresh investment because utilities target lower no-load losses in distribution transformers. Hard/permanent magnets, however, are expanding at a 6.98% CAGR through 2031, because each electric vehicle, wind turbine, or industrial robot adds multiple permanent-magnet motors, accelerating growth in the magnetic materials market. Semi-hard grades, with intermediate coercivity, are being squeezed out as designers either jump to NdFeB for permanent bias or retreat to ferrite for switchable fields. Global efficiency rules (IE4/IE5) almost require permanent magnets to meet regulatory thresholds, reinforcing the tilt toward hard materials. Meanwhile, USB Power Delivery chargers drive more soft-ferrite demand for high-flux inductors in consumer electronics.
Complete Report Scope:
- By Material
- Neodymium-Iron-Boron (NdFeB)
- Ferrite
- Samarium-Cobalt (SmCo)
- Aluminum-Nickel-Cobalt (AlNiCo)
- Other Materials (Electrical Steel (GO and NGO), Nanocrystalline and Amorphous Alloys)
- By Type
- Soft Magnetic Materials
- Hard/Permanent Magnetic Materials
- Semi-Hard Magnetic Materials
- By Application
- Electric Motors and Generators
- Transformers and Inductors
- Sensors and Actuators
- Magnetic Storage and MRAM
- Magnetic Refrigeration
- EMI / EMC Components
- By End-user Industry
- Electronics
- Automotive
- Power Generation
- Industrial
- Other End-user Industries (Home Appliances, Healthcare, Aerospace, etc.)
- By Geography
- Asia-Pacific
- China
- India
- Japan
- South Korea
- ASEAN Countries
- Rest of Asia-Pacific
- North America
- United States
- Canada
- Mexico
- Europe
- Germany
- United Kingdom
- Italy
- France
- NORDIC Countries
- Rest of Europe
- South America
- Brazil
- Argentina
- Rest of South America
- Middle-East and Africa
- Saudi Arabia
- South Africa
- Rest of Middle-East and Africa
- Asia-Pacific
Geography Analysis
Asia-Pacific captured 67.23% of 2025 tonnage and is on track for a 7.77% CAGR to 2031, reflecting China's 180,000-ton NdFeB output, Japan's high-coercivity specialties, and South Korea's MRAM scale-up. China produced major magnetic materials in 2025 across ferrite, electrical steel, and sintered NdFeB, with vertically integrated majors controlling oxide through machining, which sustains low cost and rapid lead times. Japan's Shin-Etsu and TDK dominate premium grades above 50 MGOe and 30 kOe coercivity, securing 30-40% price premiums over commodity blocks. India is emerging as a ferrite hub for domestic smartphones and two-wheelers, but still imports 95% of rare-earth oxides, exposing it to Chinese policy shifts.
North America held a moderate share, and MP Materials' Stage II alloy line will shave import dependence to 70% by 2027, yet Canada's pilot separation capacity remains under 1,000 tons, insufficient for even one automaker. In Europe, local magnet capacity covers barely 5% of need; VACUUMSCHMELZE and Proterial feed data-center cores yet rely on Chinese ribbon, showing the difficulty of onshoring full supply chains. South America and the Middle East and Africa's shares are driven by mining equipment and grid upgrades, with Brazil exploring rare-earth extraction from iron-ore tailings that may not commercialize before 2028.
- Adams Magnetic Products
- ArcelorMittal
- Arnold Magnetic Technologies
- Daido Steel Co., Ltd.
- Dexter Magnetic Technologies
- DMEGC Magnetics Co., Ltd.
- Electron Energy Corporation
- GKN Powder Metallurgy
- Hengdian Group Holdings Limited
- Lynas Rare Earths Ltd.
- MP Materials Corp.
- NEO
- Ningbo Yunsheng Co., Ltd.
- Niterra Materials Co., Ltd.
- Proterial, Ltd.
- Quadrant
- Shin-Etsu Chemical Co., Ltd.
- Steward Advanced Materials LLC
- TDK Corporation
- VACUUMSCHMELZE GmbH & Co. KG
Additional Benefits:
- The market estimate (ME) sheet in Excel format
- 3 months of analyst support
TABLE OF CONTENTS
1 Introduction
- 1.1 Study Assumptions and Market Definition
- 1.2 Scope of the Study
2 Research Methodology
3 Executive Summary
4 Market Landscape
- 4.1 Market Overview
- 4.2 Market Drivers
- 4.2.1 Rising Electric Vehicle Adoption Fuels Demand for Magnetic Materials
- 4.2.2 Grid-Scale Wind-Turbine Gearless Generators Adoption
- 4.2.3 AI-Enabled Factory Automation Boosts Sensor Magnets
- 4.2.4 Growing Robotics and Automation Usage Accelerates Magnetic Materials Demand
- 4.2.5 High-Frequency Power Electronics Need Nanocrystalline Cores
- 4.3 Market Restraints
- 4.3.1 REE Mining ESG Backlash Intensifies in OECD Nations
- 4.3.2 China Export-Control Risk on Nd and Dy Oxides
- 4.3.3 Slow Scale-Up Of Closed-Loop NdFeB Recycling
- 4.4 Value Chain Analysis
- 4.5 Regulatory Outlook
- 4.6 Porter's Five Forces
- 4.6.1 Bargaining Power of Suppliers
- 4.6.2 Bargaining Power of Buyers
- 4.6.3 Threat of New Entrants
- 4.6.4 Threat of Substitutes
- 4.6.5 Degree of Competition
5 Market Size and Growth Forecasts (Volume)
- 5.1 By Material
- 5.1.1 Neodymium-Iron-Boron (NdFeB)
- 5.1.2 Ferrite
- 5.1.3 Samarium-Cobalt (SmCo)
- 5.1.4 Aluminum-Nickel-Cobalt (AlNiCo)
- 5.1.5 Other Materials (Electrical Steel (GO and NGO), Nanocrystalline and Amorphous Alloys)
- 5.2 By Type
- 5.2.1 Soft Magnetic Materials
- 5.2.2 Hard/Permanent Magnetic Materials
- 5.2.3 Semi-Hard Magnetic Materials
- 5.3 By Application
- 5.3.1 Electric Motors and Generators
- 5.3.2 Transformers and Inductors
- 5.3.3 Sensors and Actuators
- 5.3.4 Magnetic Storage and MRAM
- 5.3.5 Magnetic Refrigeration
- 5.3.6 EMI / EMC Components
- 5.4 By End-user Industry
- 5.4.1 Electronics
- 5.4.2 Automotive
- 5.4.3 Power Generation
- 5.4.4 Industrial
- 5.4.5 Other End-user Industries (Home Appliances, Healthcare, Aerospace, etc.)
- 5.5 By Geography
- 5.5.1 Asia-Pacific
- 5.5.1.1 China
- 5.5.1.2 India
- 5.5.1.3 Japan
- 5.5.1.4 South Korea
- 5.5.1.5 ASEAN Countries
- 5.5.1.6 Rest of Asia-Pacific
- 5.5.2 North America
- 5.5.2.1 United States
- 5.5.2.2 Canada
- 5.5.2.3 Mexico
- 5.5.3 Europe
- 5.5.3.1 Germany
- 5.5.3.2 United Kingdom
- 5.5.3.3 Italy
- 5.5.3.4 France
- 5.5.3.5 NORDIC Countries
- 5.5.3.6 Rest of Europe
- 5.5.4 South America
- 5.5.4.1 Brazil
- 5.5.4.2 Argentina
- 5.5.4.3 Rest of South America
- 5.5.5 Middle-East and Africa
- 5.5.5.1 Saudi Arabia
- 5.5.5.2 South Africa
- 5.5.5.3 Rest of Middle-East and Africa
- 5.5.1 Asia-Pacific
6 Competitive Landscape
- 6.1 Market Concentration
- 6.2 Strategic Moves
- 6.3 Market Share(%)/Ranking Analysis
- 6.4 Company Profiles (includes Global level Overview, Market level overview, Core Segments, Financials as available, Strategic Information, Products and Services, and Recent Developments)
- 6.4.1 Adams Magnetic Products
- 6.4.2 ArcelorMittal
- 6.4.3 Arnold Magnetic Technologies
- 6.4.4 Daido Steel Co., Ltd.
- 6.4.5 Dexter Magnetic Technologies
- 6.4.6 DMEGC Magnetics Co., Ltd.
- 6.4.7 Electron Energy Corporation
- 6.4.8 GKN Powder Metallurgy
- 6.4.9 Hengdian Group Holdings Limited
- 6.4.10 Lynas Rare Earths Ltd.
- 6.4.11 MP Materials Corp.
- 6.4.12 NEO
- 6.4.13 Ningbo Yunsheng Co., Ltd.
- 6.4.14 Niterra Materials Co., Ltd.
- 6.4.15 Proterial, Ltd.
- 6.4.16 Quadrant
- 6.4.17 Shin-Etsu Chemical Co., Ltd.
- 6.4.18 Steward Advanced Materials LLC
- 6.4.19 TDK Corporation
- 6.4.20 VACUUMSCHMELZE GmbH & Co. KG
7 Market Opportunities and Future Outlook
- 7.1 White-space and Unmet-Need Assessment

