PUBLISHER: Mordor Intelligence | PRODUCT CODE: 2114991

PUBLISHER: Mordor Intelligence | PRODUCT CODE: 2114991
Programmable Robots - Market Share Analysis, Industry Trends & Statistics, Growth Forecasts (2026 - 2031)
According to Mordor Intelligence, programmable robots market size in 2026 is estimated at USD 5.55 billion, growing from 2025 value of USD 4.83 billion with 2031 projections showing USD 11.12 billion, growing at 14.92% CAGR over 2026-2031.
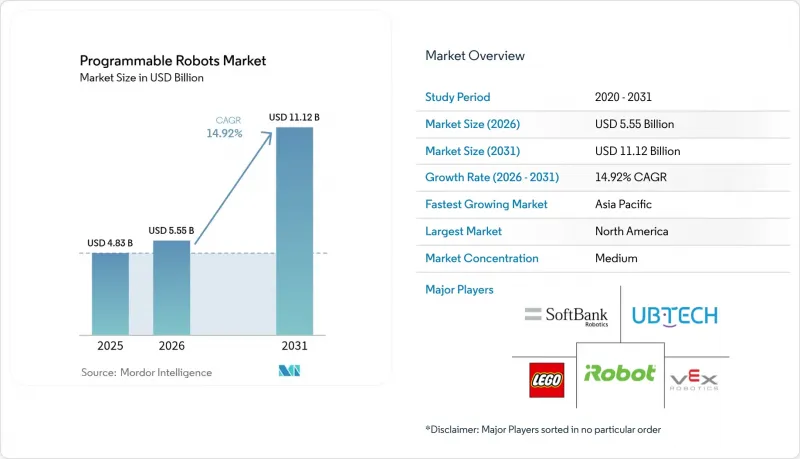
This report is Segmented by Component (Hardware, Software, Services), Mobility Type (Wheeled, Tracked, Legged/Humanoid, and More), Programming Environment (Graphical, Script-Based, ROS-Based), Application (Education, Entertainment, Household Tasks, and More), End-User (K-12 Schools, Higher-Education and Research Labs, and More), and by Geography. The Market Forecasts are Provided in Terms of Value (USD).
Global Programmable Robots Market Trends and Insights
Surge in STEM-Based Educational Curricula Adoption
Robotics has shifted from extracurricular clubs to core classroom requirements, converting discretionary spending into baseline infrastructure outlays. Carnegie Mellon University's decision to embed VEX V5 vision-sensor modules across its 2025 K-12 programs illustrates how advanced perception is entering early education. Standardized curricula create predictable procurement cycles, letting vendors amortize tooling costs and scale production. Longitudinal studies show that hands-on robotics raises test-score performance in problem-solving domains versus traditional instruction. As school districts lock in multi-year contracts, the programmable robots market secures steady revenue visibility, encouraging entrants to invest in purpose-built education platforms.
Falling Li-Ion Battery Prices Enabling Lighter Untethered Kits
Commodity battery cells leveraged from the electric-vehicle supply chain have reduced cost per watt-hour and improved energy density. Lighter chassis designs now support full-day classroom operation without power tethers, cutting infrastructure costs associated with fixed charging docks. Portable kits also widen the addressable base to after-school programs and remote learning environments. Price elasticity data gathered from 2024 district tenders shows a direct correlation between lower battery pack costs and order quantities for entry-level robotic kits, strengthening volume-based purchasing negotiations.
Up-Front Capex Versus Fast-Evolving Feature Sets
School districts face budget cycles that lock specifications for three to five years, yet robotics platforms refresh annually. Buyers fear technological obsolescence, often delaying purchases until standardized feature baselines emerge. Subscription models that bundle hardware refresh options are starting to mitigate this risk but require new procurement policies. The mismatch between capital-approval timelines and rapid component innovation tempers immediate demand, particularly in markets with constrained education budgets.
Other drivers and restraints analyzed in the detailed report include:
- Mainstream Availability of Open-Source MCU Boards
- AI-on-Edge Chips Enabling On-Board Vision and Speech
- Shortage of Classroom-Ready Coding Instructors
For complete list of drivers and restraints, kindly check the Table Of Contents.
Segment Analysis
Hardware commanded 63.65% of programmable robots market share in 2025, reflecting the capital intensity of mechanical assemblies, sensors, and drive systems. The programmable robots market size for hardware exceeded USD 3.07 billion and is set to grow alongside curriculum mandates that view robots as durable assets. Modular chassis and standardized sensor sockets lower integration friction, enabling cross-grade reusability.
Software, though smaller in revenue, yields margins exceeding 70% for vendors offering subscription upgrades. Services, posting 15.18% CAGR, monetize training hours, lesson-plan libraries, and extended warranties, providing recurring cash flows that smooth hardware seasonality. Institutions increasingly benchmark total cost of ownership, prompting suppliers to bundle hardware, cloud dashboards, and teacher professional-development credits into unified contracts. Over the forecast period, vendors able to translate one-time hardware wins into annuity-style service revenues will outperform peers.
Wheeled robots retained 48.85% programmable robots market share in 2025 because their low part counts and classroom-safe profiles facilitate immediate deployment. The segment benefits from abundant off-the-shelf drivetrain components, keeping average selling prices within public-school grant thresholds.
Yet humanoid and other legged variants are projected to capture a rising slice of programmable robots market size, growing at 15.74% CAGR as actuator prices fall and control algorithms mature. Engineering programs in Europe increasingly adopt bipedal kits to teach gait-planning and force-feedback principles, suggesting a demand spill-over from entertainment and healthcare pilots. Vendors that field platform families spanning wheeled, tracked, and legged options can upsell advanced models as students progress, locking institutions into brand ecosystems.
Complete Report Scope:
- By Component
- Hardware
- Software
- Services
- By Mobility Type
- Wheeled
- Tracked
- Legged/Humanoid
- Modular/Re-configurable
- By Programming Environment
- Graphical (Scratch/Block-based)
- Script-based (Python/C/C++)
- ROS-based
- By Application
- Education
- Entertainment
- Household Tasks
- Research and Prototyping
- By End-user
- K-12 Schools
- Higher-Education and Research Labs
- Consumers (DIY/Hobbyists)
- Theme Parks and Exhibition Centres
- By Geography
- North America
- United States
- Canada
- Mexico
- South America
- Brazil
- Argentina
- Rest of South America
- Europe
- Germany
- United Kingdom
- France
- Italy
- Russia
- Rest of Europe
- Asia Pacific
- China
- Japan
- India
- South Korea
- Australia
- Rest of Asia Pacific
- Middle East and Africa
- Middle East
- Saudi Arabia
- UAE
- Turkey
- Rest of Middle East
- Africa
- South Africa
- Nigeria
- Rest of Africa
- Middle East
- North America
Geography Analysis
North America held 37.35% programmable robots market share in 2025, underpinned by robust district-level education funding and the National Science Foundation's expanded robotics grants. Safety frameworks such as UL 3300 and ISO 13482 accelerate time-to-classroom by clarifying compliance pathways. Vendors leverage extensive reseller networks and in-school demonstration programs to shorten sales cycles. Canada's industrial-policy tilt toward advanced manufacturing and Mexico's integration into North American supply chains support regional component sourcing, mitigating tariff exposure.
Asia-Pacific is projected to deliver a 16.42% CAGR, fastest worldwide, as China mobilizes USD 138 billion for robotics acceleration and establishes training facilities in all provincial capitals.South Korea's KRW 200 billion infrastructure program and Japan's New Robot Strategy funnel capital toward domestic OEMs, reinforcing local supply-base resilience. India's National Education Policy emphasizes coding from grade six, unlocking a vast incremental learner cohort. Regional vendors exploit proximity to semiconductor fabs and battery plants, allowing competitive pricing without compromising feature sets.
Europe records steady growth, anchored by Horizon Europe's EUR 100 billion innovation budget and Germany's High-Tech Strategy 2025 allocations. The United Kingdom's Smart Machines Strategy 2035 forecasts GBP 150 billion in robotics-related GVA, offering a long runway for education-technology investments.However, stringent General Product Safety Regulation updates add compliance costs, favoring suppliers with dedicated regulatory-affairs teams. Pan-European robotics competitions foster ecosystem collaboration, indirectly driving cross-border kit standardization.
- iRobot Corporation
- Lego Group
- SoftBank Robotics
- UBTECH Robotics
- VEX Robotics (Innovation First)
- Modular Robotics Inc.
- DJI Technology Co.
- Pudu Robotics
- Xiaomi Corp. (CyberDog)
- Hanson Robotics
- Honda Motor Co. (ASIMO legacy)
- WowWee Group Ltd.
- Fischertechnik GmbH
- SuperDroid Robots Inc.
- Makeblock Co. Ltd.
- Robolink Inc.
- Robotis Co. Ltd.
- Kinova Inc.
- Nippon Electric Company (Nao joint IP)
- GJS Robot
Additional Benefits:
- The market estimate (ME) sheet in Excel format
- 3 months of analyst support
TABLE OF CONTENTS
1 INTRODUCTION
- 1.1 Study Assumptions and Market Definition
- 1.2 Scope of the Study
2 RESEARCH METHODOLOGY
3 EXECUTIVE SUMMARY
4 MARKET LANDSCAPE
- 4.1 Market Overview
- 4.2 Market Drivers
- 4.2.1 Surge in STEM-based educational curricula adoption
- 4.2.2 Falling Li-ion battery prices enabling lighter untethered kits
- 4.2.3 Mainstream availability of open-source MCU boards (Arduino, RPi)
- 4.2.4 AI-on-edge chips enabling on-board vision and speech
- 4.2.5 National robotics strategies (e.g., South Korea, UAE)
- 4.2.6 Growing demand for tele-presence care robots in ageing societies
- 4.3 Market Restraints
- 4.3.1 Up-front capex vs. fast-evolving feature sets (obsolescence risk)
- 4.3.2 Shortage of classroom-ready coding instructors
- 4.3.3 Safety certification bottlenecks for home robots
- 4.3.4 Supply-chain fragility for small-run custom actuators
- 4.4 Value / Supply-Chain Analysis
- 4.5 Regulatory Landscape
- 4.6 Technological Outlook
- 4.7 Porter's Five Forces
- 4.7.1 Threat of New Entrants
- 4.7.2 Bargaining Power of Buyers
- 4.7.3 Bargaining Power of Suppliers
- 4.7.4 Threat of Substitutes
- 4.7.5 Intensity of Competitive Rivalry
5 MARKET SIZE AND GROWTH FORECASTS (VALUE)
- 5.1 By Component
- 5.1.1 Hardware
- 5.1.2 Software
- 5.1.3 Services
- 5.2 By Mobility Type
- 5.2.1 Wheeled
- 5.2.2 Tracked
- 5.2.3 Legged/Humanoid
- 5.2.4 Modular/Re-configurable
- 5.3 By Programming Environment
- 5.3.1 Graphical (Scratch/Block-based)
- 5.3.2 Script-based (Python/C/C++)
- 5.3.3 ROS-based
- 5.4 By Application
- 5.4.1 Education
- 5.4.2 Entertainment
- 5.4.3 Household Tasks
- 5.4.4 Research and Prototyping
- 5.5 By End-user
- 5.5.1 K-12 Schools
- 5.5.2 Higher-Education and Research Labs
- 5.5.3 Consumers (DIY/Hobbyists)
- 5.5.4 Theme Parks and Exhibition Centres
- 5.6 By Geography
- 5.6.1 North America
- 5.6.1.1 United States
- 5.6.1.2 Canada
- 5.6.1.3 Mexico
- 5.6.2 South America
- 5.6.2.1 Brazil
- 5.6.2.2 Argentina
- 5.6.2.3 Rest of South America
- 5.6.3 Europe
- 5.6.3.1 Germany
- 5.6.3.2 United Kingdom
- 5.6.3.3 France
- 5.6.3.4 Italy
- 5.6.3.5 Russia
- 5.6.3.6 Rest of Europe
- 5.6.4 Asia Pacific
- 5.6.4.1 China
- 5.6.4.2 Japan
- 5.6.4.3 India
- 5.6.4.4 South Korea
- 5.6.4.5 Australia
- 5.6.4.6 Rest of Asia Pacific
- 5.6.5 Middle East and Africa
- 5.6.5.1 Middle East
- 5.6.5.1.1 Saudi Arabia
- 5.6.5.1.2 UAE
- 5.6.5.1.3 Turkey
- 5.6.5.1.4 Rest of Middle East
- 5.6.5.2 Africa
- 5.6.5.2.1 South Africa
- 5.6.5.2.2 Nigeria
- 5.6.5.2.3 Rest of Africa
- 5.6.5.1 Middle East
- 5.6.1 North America
6 COMPETITIVE LANDSCAPE
- 6.1 Market Concentration
- 6.2 Strategic Moves
- 6.3 Market Share Analysis
- 6.4 Company Profiles (includes Global level Overview, Market level overview, Core Segments, Financials as available, Strategic Information, Market Rank/Share for key companies, Products and Services, and Recent Developments)
- 6.4.1 iRobot Corporation
- 6.4.2 Lego Group
- 6.4.3 SoftBank Robotics
- 6.4.4 UBTECH Robotics
- 6.4.5 VEX Robotics (Innovation First)
- 6.4.6 Modular Robotics Inc.
- 6.4.7 DJI Technology Co.
- 6.4.8 Pudu Robotics
- 6.4.9 Xiaomi Corp. (CyberDog)
- 6.4.10 Hanson Robotics
- 6.4.11 Honda Motor Co. (ASIMO legacy)
- 6.4.12 WowWee Group Ltd.
- 6.4.13 Fischertechnik GmbH
- 6.4.14 SuperDroid Robots Inc.
- 6.4.15 Makeblock Co. Ltd.
- 6.4.16 Robolink Inc.
- 6.4.17 Robotis Co. Ltd.
- 6.4.18 Kinova Inc.
- 6.4.19 Nippon Electric Company (Nao joint IP)
- 6.4.20 GJS Robot
7 MARKET OPPORTUNITIES AND FUTURE OUTLOOK
- 7.1 White-space and Unmet-Need Assessment

