PUBLISHER: Mordor Intelligence | PRODUCT CODE: 2115103

PUBLISHER: Mordor Intelligence | PRODUCT CODE: 2115103
Viscosupplementation - Market Share Analysis, Industry Trends & Statistics, Growth Forecasts (2026 - 2031)
According to Mordor Intelligence, the viscosupplementation market size is expected to grow from USD 4.34 billion in 2025 to USD 4.73 billion in 2026 and is forecast to reach USD 7.31 billion by 2031 at 9.05% CAGR over 2026-2031.
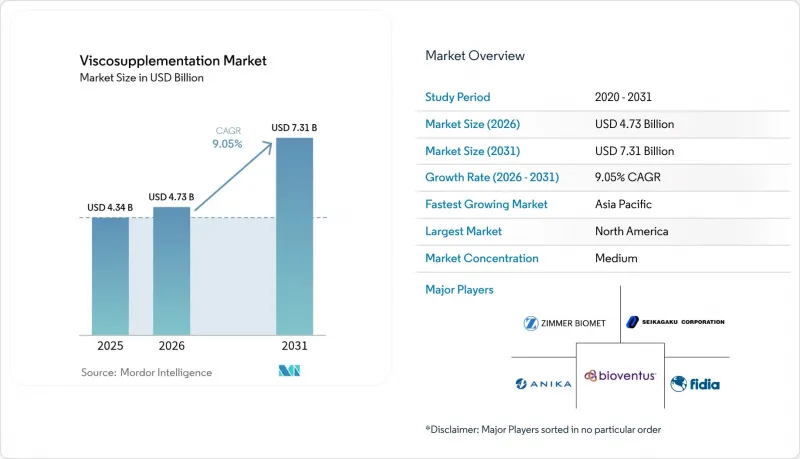
This report is Segmented by Dosage (Single Injection, Three Injection, Five Injection), Product Source (Avian-Derived HA, Non-Avian), Application Site (Knee, Hip, Shoulder, Others), End-User (Hospitals, Ambulatory Surgical Centers, Orthopedic & Sports Clinics, Others), and Geography (North America, Europe, Asia-Pacific, and More). The Market Forecasts are Provided in Terms of Value (USD).
Global Viscosupplementation Market Trends and Insights
Ageing-Linked OA Prevalence Surge
Worldwide osteoarthritis cases climbed to 607 million in 2021, with knee disease making up more than 56% of the burden. The age-standardized prevalence rate rose from 6,393.1 to 6,967.3 per 100,000. Obesity contributes approximately 4.43 million disability-adjusted life years, amplifying joint degeneration severity. Health-economic analyses show viscosupplementation delays knee arthroplasty and lowers lifetime treatment expense, positioning the therapy as a fiscal lever for payers coping with an ageing base.
Shift to Single-Injection HA Regimens
Randomized trials confirm that single-injection hyaluronic acid provides pain relief comparable to multi-dose courses while reducing clinic visits. FDA clearance of Monovisc, the first single-injection, non-animal product, accelerated adoption. Yet head-to-head studies show three low-dose injections can yield better functional scores than one high-dose shot. Manufacturers are therefore raising molecular weight to prolong residence time, aiming to reconcile convenience with peak efficacy.
Clinical-Efficacy Debate & Payer Push-Back
The American College of Rheumatology and the American Academy of Orthopaedic Surgeons classify viscosupplementation evidence as limited, fueling insurer caution. Meta-analyses show high study heterogeneity, allowing payers to impose step-therapy criteria that favor NSAIDs or corticosteroids first. Platelet-rich plasma now records stronger long-term results in several trials, prompting coverage committees to revisit HA reimbursement. Providers must compile detailed conservative-treatment histories to secure payment, elevating the administrative load.
Other drivers and restraints analyzed in the detailed report include:
- Product Approvals & Reimbursement Expansions
- Fermentation-Based Vegan HA Supply Scalability
- FDA Device-to-Drug Reclassification Risk
For complete list of drivers and restraints, kindly check the Table Of Contents.
Segment Analysis
Single-injection products captured 45.72% of the viscosupplementation market share in 2025 and command a 9.41% CAGR to 2031. The Viscosupplementation market size tied to single-dose regimens is forecast at USD 3.38 billion in 2031. The popularity stems from reduced clinic time and lower procedural fees. Three-injection courses retain relevance for patients needing incremental symptom control, while five-shot regimens serve severe bilateral disease.
Clinical data show concentrated cross-linked preparations sustain symptom relief over 60 days. Ongoing formulation work seeks to match the functional gains of multi-dose protocols by boosting viscoelasticity and residence time of single shots. Manufacturers exploit this clinical tension to position premium high-molecular-weight brands at the intersection of convenience and efficacy.
Avian sources held 53.65% of the viscosupplementation market size in 2025, thanks to decades of clinical familiarity. However, fermentation products grow 9.32% annually as the Viscosupplementation market prioritizes supply security and vegan labelling. The Viscosupplementation market size for non-avian HA is projected to reach USD 3.42 billion by 2031.
Process innovation allows bespoke molecular-weight spectra without the viral-contamination risks linked to rooster comb extract. Companies hedge by running parallel avian and fermentation lines, but long-range capex tilts toward fermenters located in China and South Korea, where feedstock and utilities cost less.
Complete Report Scope:
- By Dosage
- Single Injection
- Three Injection
- Five Injection
- By Product Source
- Avian-derived HA
- Non-Avian
- By Application Site
- Knee
- Hip
- Shoulder
- Others
- By End-User
- Hospitals
- Ambulatory Surgical Centers
- Orthopedic & Sports Clinics
- Others
- By Geography
- North America
- United States
- Canada
- Mexico
- Europe
- Germany
- United Kingdom
- France
- Italy
- Spain
- Rest of Europe
- Asia-Pacific
- China
- Japan
- India
- Australia
- South Korea
- Rest of Asia-Pacific
- Middle East and Africa
- GCC
- South Africa
- Rest of Middle East and Africa
- South America
- Brazil
- Argentina
- Rest of South America
- North America
Geography Analysis
North America contributed 41.45% of the viscosupplementation market share in 2025 and is forecast to grow at 8.98% CAGR until 2031. HCPCS codes J7318-J7329 assure reimbursement continuity, but payers are tightening prior-authorisation rules that lengthen approval cycles. FDA product clearances sustain pipeline momentum, yet looming device-to-drug reclassification could inflate compliance spending, particularly for smaller entrants. Distribution partnerships, such as the renewal between Anika Therapeutics and Pendopharm that extends to 2030, reinforce market depth.
Asia-Pacific registers the top 9.58% CAGR, driven by urban hospitals adopting minimally invasive pain procedures and by domestic HA producers scaling fermentation capacity. Government import-substitution policies in China and India nudge buyers toward local brands, trimming landed cost. Rising life expectancy and joint-disease prevalence in Japan and South Korea sustain demand even in mature payer environments.
Europe advances at 8.66% CAGR under the strict EU Medical Devices Regulation that mandates post-market performance studies. The paperwork burden weeds out small labelers, handing advantage to well-capitalised suppliers. Middle East & Africa follow at 8.51% CAGR on the back of hospital expansion in Gulf Cooperation Council states, whereas South America trails at 8.07% due to fiscal austerity and uneven insurance penetration. Collectively, emerging regions form the next frontier once regulatory clarity and payer frameworks solidify.
- Anika Therapeutics
- Aptissen SA
- Biotech Healthcare Group
- Bioventus Inc.
- Roche
- Ferring Pharmaceuticals
- Fidia Farmaceutici
- Hikma Pharmaceuticals Public Limited Company
- Huons Global Co., Ltd.
- IBSA Institut Biochimique SA
- Johnson & Johnson
- Kolon TissueGene, Inc.
- LG Chem, Ltd.
- Lupin
- OrthogenRx, Inc.
- Sanofi
- Seikagaku
- Teva Pharmaceutical Industries
- Viatris
- Wellchem Pharma Private Limited
- Zimmer Biomet
Additional Benefits:
- The market estimate (ME) sheet in Excel format
- 3 months of analyst support
TABLE OF CONTENTS
1 Introduction
- 1.1 Study Assumptions & Market Definition
- 1.2 Scope of the Study
2 Research Methodology
3 Executive Summary
4 Market Landscape
- 4.1 Market Overview
- 4.2 Market Drivers
- 4.2.1 Ageing?Linked OA Prevalence Surge
- 4.2.2 Shift to Single-Injection HA Regimens
- 4.2.3 Product Approvals & Reimbursement Expansions
- 4.2.4 Fermentation-Based Vegan HA Supply Scalability
- 4.2.5 Ultrasound-Guided Injections in ASC Networks
- 4.2.6 Regenerative Combo Injectables
- 4.3 Market Restraints
- 4.3.1 Clinical-Efficacy Debate & Payer Push-Back
- 4.3.2 FDA Device-to-Drug Re-Classification Risk
- 4.3.3 Avian-Supply Shocks from H5N1 Outbreaks
- 4.3.4 Growing Adoption of PRP/MSCs as Substitutes
- 4.4 Supply Chain Analysis
- 4.5 Regulatory Landscape
- 4.6 Technological Outlook
- 4.7 Porter's Five Forces Analysis
- 4.7.1 Threat of New Entrants
- 4.7.2 Bargaining Power of Buyers
- 4.7.3 Bargaining Power of Suppliers
- 4.7.4 Threat of Substitutes
- 4.7.5 Intensity of Competitive Rivalry
5 Market Size & Growth Forecasts (Value)
- 5.1 By Dosage
- 5.1.1 Single Injection
- 5.1.2 Three Injection
- 5.1.3 Five Injection
- 5.2 By Product Source
- 5.2.1 Avian-derived HA
- 5.2.2 Non-Avian
- 5.3 By Application Site
- 5.3.1 Knee
- 5.3.2 Hip
- 5.3.3 Shoulder
- 5.3.4 Others
- 5.4 By End-User
- 5.4.1 Hospitals
- 5.4.2 Ambulatory Surgical Centers
- 5.4.3 Orthopedic & Sports Clinics
- 5.4.4 Others
- 5.5 By Geography
- 5.5.1 North America
- 5.5.1.1 United States
- 5.5.1.2 Canada
- 5.5.1.3 Mexico
- 5.5.2 Europe
- 5.5.2.1 Germany
- 5.5.2.2 United Kingdom
- 5.5.2.3 France
- 5.5.2.4 Italy
- 5.5.2.5 Spain
- 5.5.2.6 Rest of Europe
- 5.5.3 Asia-Pacific
- 5.5.3.1 China
- 5.5.3.2 Japan
- 5.5.3.3 India
- 5.5.3.4 Australia
- 5.5.3.5 South Korea
- 5.5.3.6 Rest of Asia-Pacific
- 5.5.4 Middle East and Africa
- 5.5.4.1 GCC
- 5.5.4.2 South Africa
- 5.5.4.3 Rest of Middle East and Africa
- 5.5.5 South America
- 5.5.5.1 Brazil
- 5.5.5.2 Argentina
- 5.5.5.3 Rest of South America
- 5.5.1 North America
6 Competitive Landscape
- 6.1 Market Concentration
- 6.2 Competitive Benchmarking
- 6.3 Market Share Analysis
- 6.4 Company Profiles (includes Global level Overview, Market level overview, Core Segments, Financials as available, Strategic Information, Market Rank/Share for key companies, Products & Services, and Recent Developments)
- 6.4.1 Anika Therapeutics, Inc.
- 6.4.2 Aptissen SA
- 6.4.3 Biotech Healthcare Group
- 6.4.4 Bioventus Inc.
- 6.4.5 F. Hoffmann-La Roche AG
- 6.4.6 Ferring Pharmaceuticals
- 6.4.7 Fidia Farmaceutici S.p.A.
- 6.4.8 Hikma Pharmaceuticals Public Limited Company
- 6.4.9 Huons Global Co., Ltd.
- 6.4.10 IBSA Institut Biochimique SA
- 6.4.11 Johnson & Johnson Services, Inc.
- 6.4.12 Kolon TissueGene, Inc.
- 6.4.13 LG Chem, Ltd.
- 6.4.14 Lupin Limited
- 6.4.15 OrthogenRx, Inc.
- 6.4.16 Sanofi S.A.
- 6.4.17 Seikagaku Corporation
- 6.4.18 Teva Pharmaceutical Industries Ltd.
- 6.4.19 Viatris Inc.
- 6.4.20 Wellchem Pharma Private Limited
- 6.4.21 Zimmer Biomet Holdings, Inc.
7 Market Opportunities & Future Outlook
- 7.1 White-space & Unmet-need Assessment

