PUBLISHER: Mordor Intelligence | PRODUCT CODE: 2115189

PUBLISHER: Mordor Intelligence | PRODUCT CODE: 2115189
Thermoformed Plastics - Market Share Analysis, Industry Trends & Statistics, Growth Forecasts (2026 - 2031)
According to Mordor Intelligence, the thermoformed plastics market size is expected to increase from USD 15.94 billion in 2025 to USD 16.84 billion in 2026 and reach USD 22.13 billion by 2031, growing at a CAGR of 5.62% over 2026-2031.
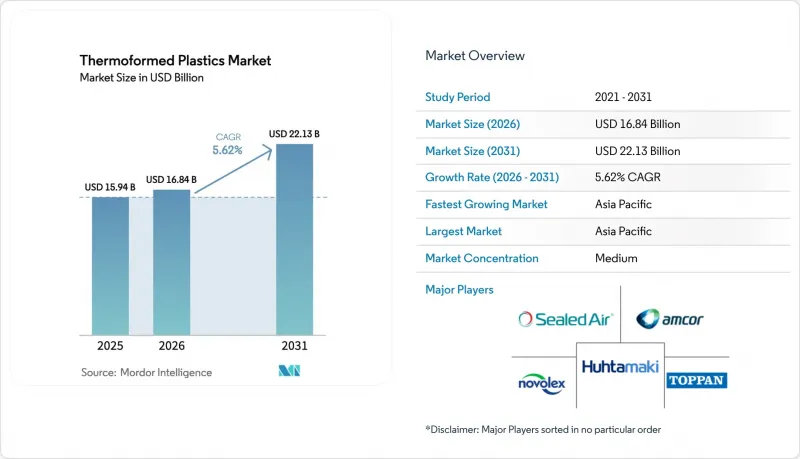
This report is Segmented by Polymer Type (PP, PE, PS, PET, PVC, PMMA, Bio-Degradable, and Others), Thermoforming Process (Vacuum, Plug Assist, Thin Gauge, and Thick Gauge), End-User Industry (Packaging, Healthcare, Automotive, Electrical, and More), and Geography (Asia-Pacific, North America, Europe, South America, and Middle East and Africa). Market Forecasts are Provided in Terms of Value (USD).
Global Thermoformed Plastics Market Trends and Insights
Surging Demand for Lightweight Sustainable Food and Beverage Packaging
California's SB 54 requires 65% recyclability for single-use plastic packaging by 2032, prompting global quick-service restaurants to replace polystyrene with recycled-PET clamshells. Amcor disclosed that recycled-content PET thermoformed containers now contribute 22% of its rigid-packaging portfolio, up from 14% in fiscal 2023. The European PPWR, effective May 2024, mandates 30% recycled content for PET and 10% for other formats by 2030. Huhtamaki responded by commissioning a EUR 50 million recycled-PET washing line in Poland with 40,000 tonnes annual capacity in January 2025. Thin-gauge thermoforming reduces film thickness from 600 microns to 450 microns, trimming 25% resin per tray while maintaining drop-test integrity required for e-grocery chains that reported 8% of parcels experiencing impacts above 3 G in 2025.
Growing Consumption of Disposable Medical and Pharmaceutical Devices
The U.S. Centers for Disease Control highlighted high-level disinfection failures in 2024, steering ambulatory surgery centers toward sterile single-use trays. Sealed Air's 2024 10-K showed 11% revenue growth in medical-device packaging, led by insulin-pen blisters complying with ISO 11607. The U.S. FDA cleared 38 new Class II devices with thermoformed housings in 2025. India's Production-Linked Incentive program earmarked INR 34 billion (USD 408 million) for domestic medical-device makers in fiscal 2025. New carbon-loaded polypropylene trays now achieve surface resistivity below 1011 ohms-per-square, preventing electrostatic failures during cardiac-device assembly.
Stringent Worldwide Single-Use-Plastic Regulations and Bans
The EU Single-Use Plastics Directive, fully enforced since July 2024, bars oxo-degradable resins and restricts polystyrene foodware, forcing restaurants to convert to polypropylene or PLA alternatives that cost 18% more. Canada's Prohibition Regulations, effective December 2024, removed 42,000 tonnes of annual thermoformed polystyrene demand. California's SB 54 sets a USD 500 million annual producer fee from 2027, penalizing multilayer trays that contaminate recycling streams. The UK Plastic Packaging Tax of GBP 210.82 per tonne on items with under 30% recycled content, in force since April 2025, eroded converters' margins by 14%. India's 2024 Plastic Waste Management rules ban thin plates and bowls below 50 microns, switching demand toward 120-micron PLA that composts within 180 days.
Other drivers and restraints analyzed in the detailed report include:
- Cost-Efficient Mass-Production for Automotive Interior Components
- Rapid E-Commerce Growth Driving Impact-Resistant Shipment Inserts
- Volatility of Crude-Linked Polymer Feed-Stock Prices
For complete list of drivers and restraints, kindly check the Table Of Contents.
Segment Analysis
Polypropylene retained a 35.67% share of the thermoformed plastics market in 2025 thanks to its low 0.90 g/cm3 density and 1,600 MPa flexural modulus that enable lightweight yet stiff food clamshells and automotive liners. Bio-degradable polymers such as polylactic acid and polyhydroxyalkanoates are forecast to grow at a 6.82% CAGR to 2031, outpacing the broader thermoformed plastics market because EU PPWR and California SB 54 favor compostable packaging for take-away applications. Recycled-content polyethylene terephthalate (rPET) is also expanding as Amcor lifted rPET containers to 22% of rigid-packaging sales in fiscal 2025. Polystyrene demand is eroding following the EU Single-Use Plastics Directive ban on expanded formats in July 2024. Polymethyl methacrylate and polycarbonate hold niche roles in 5G radome housings and electric-vehicle battery covers, where UV stability and UL 94 V-0 ratings outweigh higher material cost.
PET trays for fresh produce now incorporate 25% post-consumer resin on average, a figure expected to hit 40% by 2030 as bottle-to-tray recycling becomes mainstream across Germany, France, and the United Kingdom. Polyvinyl chloride remains concentrated in blister packs complying with ISO 15378; however, pharmaceutical brand owners are piloting PET-G alternatives to sidestep chlorine-content disposal hurdles. Polyamide and glass-fiber-reinforced polypropylene appear in structural thermoformed parts for battery-electric vehicles where metal substitution reduces weight by up to 45% and improves corrosion resistance over 10-year duty cycles.
Complete Report Scope:
- By Polymer Type
- Polypropylene (PP)
- Polyethylene (PE)
- Polystyrene (PS)
- Polyethylene Terephthalate (PET)
- Polyvinyl Chloride (PVC)
- Polymethyl Methacrylate (PMMA)
- Bio-degradable Polymers
- Other Polymer Types (Polycarbonate, Polyamide, etc.)
- By Thermoforming Process
- Vacuum Forming
- Plug Assist Forming
- Thin Gauge Thermoforming
- Thick Gauge Thermoforming
- By End-User Industry
- Packaging
- Healthcare and Medical Devices
- Automotive
- Electrical and Electronics
- Construction and Building
- Consumer Goods and Appliances
- Other End-User Industries (Aerospace and Defense, Agriculture, etc.)
- By Geography
- Asia-Pacific
- China
- India
- Japan
- South Korea
- ASEAN Countries
- Rest of Asia-Pacific
- North America
- United States
- Canada
- Mexico
- Europe
- Germany
- United Kingdom
- Italy
- France
- Russia
- Rest of Europe
- South America
- Brazil
- Argentina
- Rest of South America
- Middle East
- Saudi Arabia
- United Arab Emirates (UAE)
- South Africa
- Egypt
- Rest of Middle-East and Africa
- Asia-Pacific
Geography Analysis
Asia-Pacific controlled 39.96% of the thermoformed plastics market in 2025 and will post the fastest 5.94% CAGR through 2031. Growth stems from China's 12 GW solar-module additions that require polypropylene junction-box housings and India's INR 34 billion (USD 408 million) Production-Linked Incentive, fueling medical-device trays. Japan's auto exports of 3.2 million units in 2024 demanded lightweight interior panels to meet 25.4 km/L fuel norms. South Korea's DRAM dominance drives electrostatic-discharge trays in semiconductor fabs, while Thailand and Indonesia collectively added 180,000 tonnes of food-packaging capacity to serve 4,200 new quick-service restaurants.
North America captured a significant revenue share in 2025, with e-commerce parcels topping 9.2 billion and sparking demand for protective inserts. The United States represented over half of regional consumption, aided by FDA clearance of 38 Class II devices using thermoformed housings in 2025. Canada's ban on foamed polystyrene cutlery redirected converters toward polypropylene and PLA alternatives. Mexico's 3.1 million vehicle assemblies leveraged domestic door-panel suppliers under USMCA local-content rules exceeding 75%.
The thermoformed plastics consumption in Europe is governed by stringent regulations. The PPWR enforces 10-30% recycled-content thresholds by 2030, encouraging Huhtamaki's EUR 50 million Polish recycling line. Germany's 3.6 million passenger-car output increasingly favors thermoformed glass-fiber trunk liners that save 1.2 grams CO2 per km over vehicle lifecycles. The UK's GBP 210.82 per-ton tax on low-recycled-content plastics shaved 14% off converter margins. Russia expanded domestic PET capacity by 65,000 tonnes during 2024 to replace imports constrained by sanctions.
South America and the Middle East are witnessing rapidly growing demand for thermoformed plastics. Brazil's 14.8 million-ton poultry sector relies on RFID-enabled feed trays to meet export bio-security audits. Argentina's recycled-content packaging supports beef and wine exports to the EU. Saudi Arabia's Vision 2030 funnels SAR 12 billion (USD 3.2 billion) into a 120,000-tonne polypropylene thermoforming facility due online in 2026. The UAE's tourism-driven food-service market still imports 82% of clamshells, signaling room for domestic capacity.
- Amcor plc
- Anchor Packaging LLC
- Brentwood Industries, Inc.
- D&W Fine Pack LLC
- Dart Container Corporation
- Display Pack
- Dongguan Ditai Plastic Products Co., Ltd.
- DS Smith plc
- Genpak, LLC
- Greiner Packaging
- Huhtamaki Oyj
- Pactiv Evergreen Inc.
- Peninsula Packaging
- Placon
- Sabert Corporation
- Sealed Air
- Silgan Holdings Inc.
- SPENCER INDUSTRIES INCORPORATED
- TOPPAN Packaging Americas Holdings, Inc.
- TriEnda Holdings, LLC
- Visipak
- Winpak Ltd.
Additional Benefits:
- The market estimate (ME) sheet in Excel format
- 3 months of analyst support
TABLE OF CONTENTS
1 Introduction
- 1.1 Study Assumptions
- 1.2 Scope of the Study
2 Research Methodology
3 Executive Summary
4 Market Landscape
- 4.1 Market Overview
- 4.2 Market Drivers
- 4.2.1 Surging demand for lightweight sustainable food and beverage packaging
- 4.2.2 Growing consumption of disposable medical and pharmaceutical devices
- 4.2.3 Cost-efficient mass-production for automotive interior components
- 4.2.4 Rapid e-commerce growth driving impact-resistant shipment inserts
- 4.2.5 Expansion of automated poultry farming feed-tray systems
- 4.3 Market Restraints
- 4.3.1 Stringent worldwide single-use-plastic regulations and bans
- 4.3.2 Volatility of crude-linked polymer feedstock prices
- 4.3.3 Emerging PFAS / micro-plastic contamination directives on trays
- 4.4 Value Chain Analysis
- 4.5 Porter's Five Forces
- 4.5.1 Bargaining Power of Suppliers
- 4.5.2 Bargaining Power of Buyers
- 4.5.3 Threat of New Entrants
- 4.5.4 Threat of Substitutes
- 4.5.5 Degree of Competition
5 Market Size and Growth Forecasts (Value)
- 5.1 By Polymer Type
- 5.1.1 Polypropylene (PP)
- 5.1.2 Polyethylene (PE)
- 5.1.3 Polystyrene (PS)
- 5.1.4 Polyethylene Terephthalate (PET)
- 5.1.5 Polyvinyl Chloride (PVC)
- 5.1.6 Polymethyl Methacrylate (PMMA)
- 5.1.7 Bio-degradable Polymers
- 5.1.8 Other Polymer Types (Polycarbonate, Polyamide, etc.)
- 5.2 By Thermoforming Process
- 5.2.1 Vacuum Forming
- 5.2.2 Plug Assist Forming
- 5.2.3 Thin Gauge Thermoforming
- 5.2.4 Thick Gauge Thermoforming
- 5.3 By End-User Industry
- 5.3.1 Packaging
- 5.3.2 Healthcare and Medical Devices
- 5.3.3 Automotive
- 5.3.4 Electrical and Electronics
- 5.3.5 Construction and Building
- 5.3.6 Consumer Goods and Appliances
- 5.3.7 Other End-User Industries (Aerospace and Defense, Agriculture, etc.)
- 5.4 By Geography
- 5.4.1 Asia-Pacific
- 5.4.1.1 China
- 5.4.1.2 India
- 5.4.1.3 Japan
- 5.4.1.4 South Korea
- 5.4.1.5 ASEAN Countries
- 5.4.1.6 Rest of Asia-Pacific
- 5.4.2 North America
- 5.4.2.1 United States
- 5.4.2.2 Canada
- 5.4.2.3 Mexico
- 5.4.3 Europe
- 5.4.3.1 Germany
- 5.4.3.2 United Kingdom
- 5.4.3.3 Italy
- 5.4.3.4 France
- 5.4.3.5 Russia
- 5.4.3.6 Rest of Europe
- 5.4.4 South America
- 5.4.4.1 Brazil
- 5.4.4.2 Argentina
- 5.4.4.3 Rest of South America
- 5.4.5 Middle East
- 5.4.5.1 Saudi Arabia
- 5.4.5.2 United Arab Emirates (UAE)
- 5.4.5.3 South Africa
- 5.4.5.4 Egypt
- 5.4.5.5 Rest of Middle-East and Africa
- 5.4.1 Asia-Pacific
6 Competitive Landscape
- 6.1 Market Concentration
- 6.2 Strategic Moves
- 6.3 Market Share(%)/Ranking Analysis
- 6.4 Company Profiles (includes Global level Overview, Market level overview, Core Segments, Financials as available, Strategic Information, Market Rank/Share for key companies, Products and Services, and Recent Developments)
- 6.4.1 Amcor plc
- 6.4.2 Anchor Packaging LLC
- 6.4.3 Brentwood Industries, Inc.
- 6.4.4 D&W Fine Pack LLC
- 6.4.5 Dart Container Corporation
- 6.4.6 Display Pack
- 6.4.7 Dongguan Ditai Plastic Products Co., Ltd.
- 6.4.8 DS Smith plc
- 6.4.9 Genpak, LLC
- 6.4.10 Greiner Packaging
- 6.4.11 Huhtamaki Oyj
- 6.4.12 Pactiv Evergreen Inc.
- 6.4.13 Peninsula Packaging
- 6.4.14 Placon
- 6.4.15 Sabert Corporation
- 6.4.16 Sealed Air
- 6.4.17 Silgan Holdings Inc.
- 6.4.18 SPENCER INDUSTRIES INCORPORATED
- 6.4.19 TOPPAN Packaging Americas Holdings, Inc.
- 6.4.20 TriEnda Holdings, LLC
- 6.4.21 Visipak
- 6.4.22 Winpak Ltd.
7 Market Opportunities and Future Outlook
- 7.1 White-space and Unmet-Need Assessment
- 7.2 Adoption of thermoformed housings in 5G telecom infrastructure

