PUBLISHER: Mordor Intelligence | PRODUCT CODE: 2116025

PUBLISHER: Mordor Intelligence | PRODUCT CODE: 2116025
Liquid Filling Machines - Market Share Analysis, Industry Trends & Statistics, Growth Forecasts (2026 - 2031)
According to Mordor Intelligence, the liquid filling machines market size is expected to grow from USD 5.55 billion in 2025 to USD 5.83 billion in 2026 and is forecast to reach USD 7.49 billion by 2031 at 5.11% CAGR over 2026-2031.
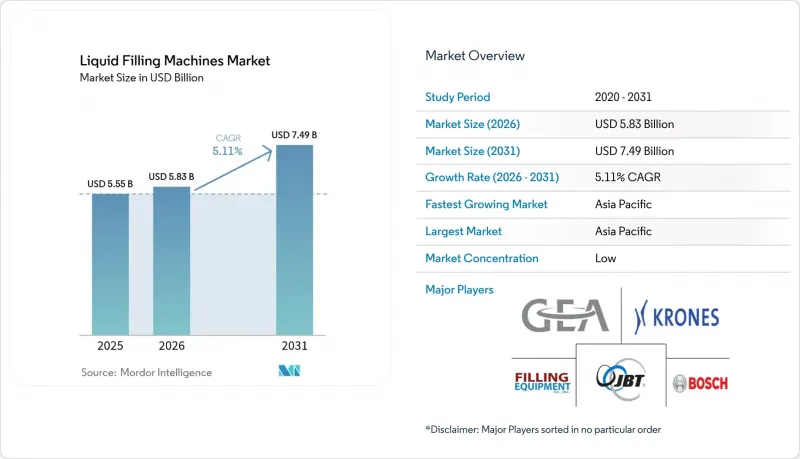
This report is Segmented by Liquid Type (Consumable Liquids, and More), Equipment Type (Automatic, and Semi-Automatic), Filling Technology (Gravity, and More) End-User Industry (Food and Beverage, Healthcare and Pharmaceutical, and More), and Geography (North America, Europe, Asia-Pacific, South America, and Middle East and Africa). The Market Forecasts are Provided in Terms of Value (USD).
Global Liquid Filling Machines Market Trends and Insights
Rising Demand for Packaged Beverages and Dairy
Liquid dairy, ready-to-drink tea and coffee, and plant-based alternatives keep bottling halls busy. Dairy alone is expanding 2.2% annually through 2027, lifting orders for machines capable of handling varying viscosities and hot-fill conditions. Equipment such as Tetra Pak's A1 1100 combines direct UHT processing with efficient changeover, reducing energy consumption and product waste. Asian processors deploy similar high-speed lines to meet consumer preference for convenient single-serve formats, and regional bottlers often specify multi-lane fillers to run flavored milk, juices and water on one frame. Demand for accurate temperature control and hygienic design is creating a premium segment within the broader liquid filling machines market.
Pharmaceutical Aseptic-Processing Boom
Biologics and personalized medicine require sterile, low-volume filling. Syntegon's Versynta microBatch, recently installed in North America, fills sub-5 ml containers with minimal product loss, making it ideal for costly mRNA formulations. EU GMP Annex 1 revisions accelerate adoption of barrier isolators and automated viable-air monitoring. The result is a sustained order pipeline for niche, high-margin machinery, especially in Europe and the United States, with Asia-Pacific contract manufacturers fast following. These dynamics keep the liquid filling machines market on an innovation treadmill where contamination control and flexible lot sizes drive R&D budgets.
High Capital Expenditure
Interest rates sit well above pre-2023 averages, lifting borrowing costs just as processors plan line upgrades. Aluminum and PET input inflation amplifies budget stress, delaying some greenfield projects. Yet 66% of surveyed food processors still expect to buy primary equipment this cycle, with India's production-linked incentives offsetting financing gaps for local buyers. This mix of pressure and policy support limits, but does not derail, the liquid filling machines market trajectory.
Other drivers and restraints analyzed in the detailed report include:
- Industry 4.0 Drives Automated, Smart Fillers
- Surge in Single-Serve Functional and Nutraceutical Drinks
- Skilled-Operator Shortage
For complete list of drivers and restraints, kindly check the Table Of Contents.
Segment Analysis
Consumable liquids held 44.82% of 2025 revenue, anchored by beverage producers that run high-speed PET and HDPE bottle lines. Rising RTD tea and flavored-milk volumes in Southeast Asia sustain fresh capex. Within the same year, liquid chemicals advanced at 8.29% CAGR, outpacing every other fluid class. Emerging solvent-free cosmetic formulations and specialty resins elevate demand for corrosion-resistant wetted parts, drip-free nozzles and CIP-ready designs.
The liquid filling machines market size for liquid chemicals is projected to widen as niche cosmetics, agrochemicals and automotive fluids require short-run, recipe-driven fillers. Specialty OEMs such as FRICKE Abfulltechnik now integrate gravimetric controls with explosion-proof housings to meet safety norms. Consumable segments remain vast, yet chemical producers are willing to pay premium margins for application-specific dosing accuracy, tilting supplier R&D priorities accordingly.
Automatic systems, at 59.62% share in 2025, form the backbone of large-volume plants. Pacific Packaging's Intelli-Fil C handles 200 containers per minute while keeping deviation below 0.5 ml, evidence of the throughput advantage that secures its 6.38% CAGR outlook. Rising electricity and labor costs also push CFOs toward fully automatic platforms to lock in longer-term cost curves.
Semi-automatic machinery retains relevance in clinical trial filling, craft cosmetics and regional beverages where batch diversity is high. The liquid filling machines industry continues to supply modular frames that allow a future bolt-on to higher automation when volumes justify. This hybrid pathway eases adoption and cushions market volatility linked to capex cycles.
Complete Report Scope:
- By Liquid Type
- Consumable liquids
- Liquid drugs
- Industrial liquids
- Liquid chemicals
- Other liquid Types
- By Equipment Type
- Automatic
- Semi-automatic
- By Filling Technology
- Gravity
- Piston
- Pump / Peristaltic
- Vacuum
- Pressure
- By End-user Industry
- Food and Beverage
- Healthcare and Pharmaceutical
- Cosmetics and Personal Care
- Chemicals
- Other End-User Industry
- By Container Type
- Bottles
- Pouches
- Cans
- Other Container Types
- By Geography
- North America
- United States
- Canada
- Mexico
- Europe
- Germany
- France
- Italy
- United Kingdom
- Spain
- Rest of Europe
- Asia-Pacific
- China
- Japan
- India
- South Korea
- ASEAN
- Rest of Asia-Pacific
- South America
- Brazil
- Argentina
- Rest of South America
- Middle East and Africa
- Middle East
- Saudi Arabia
- United Arab Emirates
- Turkey
- Rest of Middle East
- Africa
- South Africa
- Kenya
- Rest of Africa
- Middle East
- North America
Geography Analysis
Asia-Pacific, owning 39.88% of 2025 global revenue, continues to outpace all regions with a 9.31% CAGR to 2031. China's 25% capital investment push in manufacturing and India's USD 165.1 billion inbound manufacturing FDI provide deep pools of demand. Multinationals install new plants while domestic OEMs supply mid-tier automatics, collectively lifting the liquid filling machines market.
North America ranks second. Packaging machinery shipments rose 5.8% in 2023 and projections point to 8.0% average growth through 2027. Regulatory stringency in pharma and functional foods sustains premium machine orders, although recent aluminum tariffs raise canning costs. Companies respond by seeking fillers that switch among bottle, can and carton with minimal downtime, protecting ROI in a price-volatile packaging landscape.
Europe shows steady replacement demand, fuelled by sustainability mandates and carbon-footprint targets. Energy-efficient servo drives and water-saving CIP cycles sway purchase decisions. Meanwhile South America and Middle East & Africa log mid-single digit growth, constrained by currency swings and infrastructure gaps but buoyed by rising urban middle-class consumption. Service hubs set up by European and Asian OEMs are reducing lead times, improving competitiveness.
- Syntegon Technology (Bosch)
- GEA Group AG
- Krones AG
- JBT Corporation
- Tetra Laval Int'l
- KHS GmbH
- Coesia SpA
- Ronchi Mario SpA
- E-PAK Machinery
- Filling Equipment Co
- Scholle IPN
- OPTIMA Group
- IMA Group
- Serac Group
- Accutek Packaging
- ProMach
- APACKS
- Shemesh Automation
- Yundu BFS
- Universal Filling
- Sidel Group
Additional Benefits:
- The market estimate (ME) sheet in Excel format
- 3 months of analyst support
TABLE OF CONTENTS
1 INTRODUCTION
- 1.1 Study Assumptions and Market Definition
- 1.2 Scope of the Study
2 RESEARCH METHODOLOGY
3 EXECUTIVE SUMMARY
4 MARKET LANDSCAPE
- 4.1 Market Overview
- 4.2 Market Drivers
- 4.2.1 Rising demand for packaged beverages and dairy
- 4.2.2 Pharmaceutical aseptic-processing boom
- 4.2.3 Industry 4.0 drives automated, smart fillers
- 4.2.4 Surge in single-serve functional and nutraceutical drinks
- 4.2.5 Metred-dose rules for cannabis beverages
- 4.2.6 Retail "zero-waste" refill stations require in-store fillers
- 4.3 Market Restraints
- 4.3.1 High capital expenditure
- 4.3.2 Skilled-operator shortage
- 4.3.3 Food-grade lubricant supply volatility hits OEE
- 4.3.4 Cyber-security risk in connected fillers delays adoption
- 4.4 Supply-Chain Analysis
- 4.5 Regulatory Landscape
- 4.6 Technological Outlook
- 4.7 Porter's Five Forces Analysis
- 4.7.1 Threat of New Entrants
- 4.7.2 Bargaining Power of Suppliers
- 4.7.3 Bargaining Power of Buyers
- 4.7.4 Threat of Substitutes
- 4.7.5 Competitive Rivalry
5 MARKET SIZE AND GROWTH FORECASTS (VALUE)
- 5.1 By Liquid Type
- 5.1.1 Consumable liquids
- 5.1.2 Liquid drugs
- 5.1.3 Industrial liquids
- 5.1.4 Liquid chemicals
- 5.1.5 Other liquid Types
- 5.2 By Equipment Type
- 5.2.1 Automatic
- 5.2.2 Semi-automatic
- 5.3 By Filling Technology
- 5.3.1 Gravity
- 5.3.2 Piston
- 5.3.3 Pump / Peristaltic
- 5.3.4 Vacuum
- 5.3.5 Pressure
- 5.4 By End-user Industry
- 5.4.1 Food and Beverage
- 5.4.2 Healthcare and Pharmaceutical
- 5.4.3 Cosmetics and Personal Care
- 5.4.4 Chemicals
- 5.4.5 Other End-User Industry
- 5.5 By Container Type
- 5.5.1 Bottles
- 5.5.2 Pouches
- 5.5.3 Cans
- 5.5.4 Other Container Types
- 5.6 By Geography
- 5.6.1 North America
- 5.6.1.1 United States
- 5.6.1.2 Canada
- 5.6.1.3 Mexico
- 5.6.2 Europe
- 5.6.2.1 Germany
- 5.6.2.2 France
- 5.6.2.3 Italy
- 5.6.2.4 United Kingdom
- 5.6.2.5 Spain
- 5.6.2.6 Rest of Europe
- 5.6.3 Asia-Pacific
- 5.6.3.1 China
- 5.6.3.2 Japan
- 5.6.3.3 India
- 5.6.3.4 South Korea
- 5.6.3.5 ASEAN
- 5.6.3.6 Rest of Asia-Pacific
- 5.6.4 South America
- 5.6.4.1 Brazil
- 5.6.4.2 Argentina
- 5.6.4.3 Rest of South America
- 5.6.5 Middle East and Africa
- 5.6.5.1 Middle East
- 5.6.5.1.1 Saudi Arabia
- 5.6.5.1.2 United Arab Emirates
- 5.6.5.1.3 Turkey
- 5.6.5.1.4 Rest of Middle East
- 5.6.5.2 Africa
- 5.6.5.2.1 South Africa
- 5.6.5.2.2 Kenya
- 5.6.5.2.3 Rest of Africa
- 5.6.5.1 Middle East
- 5.6.1 North America
6 COMPETITIVE LANDSCAPE
- 6.1 Market Concentration
- 6.2 Strategic Moves
- 6.3 Market Share Analysis
- 6.4 Company Profiles (includes Global level Overview, Market level overview, Core Segments, Financials as available, Strategic Information, Market Rank/Share for key companies, Products and Services, and Recent Developments)
- 6.4.1 Syntegon Technology (Bosch)
- 6.4.2 GEA Group AG
- 6.4.3 Krones AG
- 6.4.4 JBT Corporation
- 6.4.5 Tetra Laval Int'l
- 6.4.6 KHS GmbH
- 6.4.7 Coesia SpA
- 6.4.8 Ronchi Mario SpA
- 6.4.9 E-PAK Machinery
- 6.4.10 Filling Equipment Co
- 6.4.11 Scholle IPN
- 6.4.12 OPTIMA Group
- 6.4.13 IMA Group
- 6.4.14 Serac Group
- 6.4.15 Accutek Packaging
- 6.4.16 ProMach
- 6.4.17 APACKS
- 6.4.18 Shemesh Automation
- 6.4.19 Yundu BFS
- 6.4.20 Universal Filling
- 6.4.21 Sidel Group
7 MARKET OPPORTUNITIES AND FUTURE OUTLOOK
- 7.1 White-space and Unmet-need Assessment

