PUBLISHER: Mordor Intelligence | PRODUCT CODE: 2116069

PUBLISHER: Mordor Intelligence | PRODUCT CODE: 2116069
Global Interleukin Inhibitors - Market Share Analysis, Industry Trends & Statistics, Growth Forecasts (2026 - 2031)
According to Mordor Intelligence, the interleukin inhibitors market size in 2026 is estimated at USD 45.23 billion, growing from 2025 value of USD 39.45 billion with 2031 projections showing USD 89.6 billion, growing at 14.64% CAGR over 2026-2031.
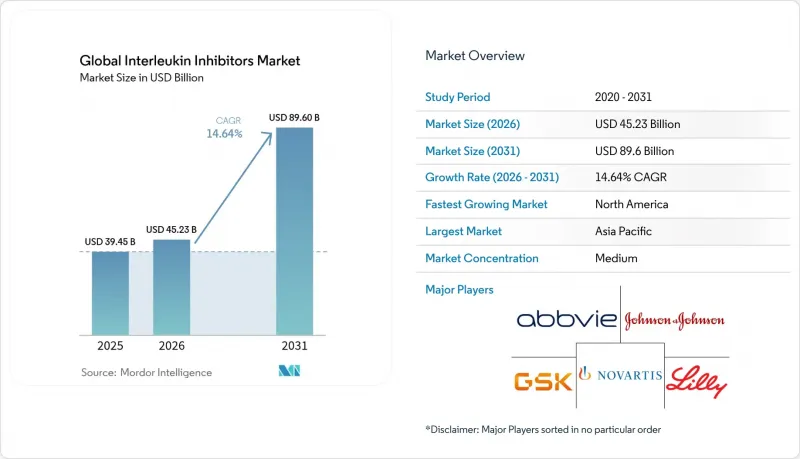
This report is Segmented by Drug Type (IL-1 Inhibitors, IL-6 Inhibitors, and More), Application (Psoriasis & Psoriatic Arthritis, and More), Route of Administration (Subcutaneous, Intravenous), End-User (Hospitals, Specialty Clinics, and More), and Geography (North America, Europe, Asia-Pacific, and More). The Market Forecasts are Provided in Terms of Value (USD), Based On Availability.
Global Interleukin Inhibitors Market Trends and Insights
Escalating Prevalence of Autoimmune & Autoinflammatory Diseases
Global autoimmune incidence has climbed, with conditions such as Graves' disease accelerating most sharply . Higher prevalence in North America and Europe concentrates demand and drives premium pricing power. Multi-morbid presentations create complex treatment pathways that favor high-specificity biologics over broad immunosuppressants. Rheumatology and dermatology clinics report growing first-line use of interleukin inhibitors, reflecting guideline evolution. Sustained epidemiologic pressure therefore preserves the long-run revenue base of the interleukin inhibitors market.
Accelerated FDA & EMA Approvals for Next-Gen IL-17/IL-23 Biologics
Between 2024 and early 2025, regulators cleared several breakthrough assets, including bimekizumab for hidradenitis suppurativa and icotrokinra as the first oral IL-23 receptor inhibitor . Expedited review pathways shorten launch cycles and support premium introductory pricing. EMA endorsement of four ustekinumab biosimilars in 2024 demonstrates parallel confidence in class safety while intensifying price competition. Collectively, faster approvals lift physician willingness to switch within the same therapeutic class when superior convenience or efficacy is shown, boosting overall interleukin inhibitors market growth.
High Acquisition Cost Versus Small-Molecule DMARDs
Annual biologic therapy costs run from USD 14,000 to USD 91,609, far exceeding older disease-modifying antirheumatic drugs. Out-of-pocket ceilings in low-income markets remain prohibitive, restricting uptake. Payers demand real-world cost-offset evidence, forcing manufacturers to deliver head-to-head superiority data with hard endpoints such as hospitalization avoidance. The pricing premium therefore suppresses full-potential demand for the interleukin inhibitors market in cost-sensitive geographies.
Other drivers and restraints analyzed in the detailed report include:
- Shift Toward Convenient Self-Injectable Formulations
- Expanding Reimbursement in Emerging Asian Markets
- Looming Biosimilar Competition Post-2026
For complete list of drivers and restraints, kindly check the Table Of Contents.
Segment Analysis
IL-17 inhibitors anchored 37.32% of 2025 revenue, underpinned by durable efficacy in plaque psoriasis, psoriatic arthritis, and ankylosing spondylitis. Despite leadership, competitive breadth has intensified as bimekizumab expanded into hidradenitis suppurativa and axial spondyloarthritis. IL-23 inhibitors exhibit the fastest 15.32% CAGR because oral icotrokinra combines convenience with disease-modifying potential. Tocilizumab sustains IL-6 inhibitor relevance through COVID-19 and giant cell arteritis expansions. Niche IL-1 inhibitors cater to rare autoinflammatory syndromes, while dual-target regimens reflect a precision trend that widens addressable patient cohorts. Collectively, differentiated mechanisms diversify the interleukin inhibitors market size across drug classes, buffering against single-class risk.
The shift from parenteral to oral small-molecule IL-23 antagonists also enlarges eligible patient pools unwilling to self-inject. Pipeline innovation contains multiple multi-cytokine inhibitors aiming for broader suppression with fewer injections. Consequently, therapeutic class evolution ensures the interleukin inhibitors market retains a balanced assortment of established and emerging modalities through 2031.
Psoriasis delivered 45.74% of 2025 value, reinforced by clear superiority over systemic steroids and phototherapy. High skin-clearance rates such as PASI 90 attainment exceed 49.6% on oral icotrokinra, renewing enthusiasm for first-line biologic adoption. Meanwhile, ankylosing spondylitis shows 15.74% CAGR as improved MRI diagnostics broaden axial spondyloarthritis recognition. Rheumatoid arthritis remains a sizeable but slower-growth cohort because mature TNF inhibitors and JAKs compete aggressively on price. Inflammatory bowel disease advances on TREMFYA's Crohn's disease label expansion, while miscellaneous autoinflammatory conditions will benefit from AI-discovered interleukin pathways. These mixed dynamics keep the interleukin inhibitors market diversified across immune-mediated disorders.
Employing biomarker-guided treatment algorithms further optimizes positioning. Dermatologists and rheumatologists increasingly triage patients by cytokine profile, matching IL-23 blockers to skin-dominant disease and IL-17 blockers to axial manifestations. Precision matching enhances therapeutic outcomes and reinforces the interleukin inhibitors market share for optimized molecules.
Complete Report Scope:
- By Drug Type
- IL-1 Inhibitors
- IL-6 Inhibitors
- IL-17 Inhibitors
- IL-23 Inhibitors
- Multi-target / Others
- By Application
- Psoriasis & Psoriatic Arthritis
- Rheumatoid Arthritis
- Inflammatory Bowel Disease (Crohn's & UC)
- Ankylosing Spondylitis
- Other Auto-Inflammatory Disorders
- By Route of Administration
- Subcutaneous
- Intravenous
- By End-user
- Hospitals
- Specialty Clinics
- Home-care / Self-administration Programs
- By Geography
- North America
- United States
- Canada
- Mexico
- Europe
- Germany
- United Kingdom
- France
- Italy
- Spain
- Rest of Europe
- Asia-Pacific
- China
- India
- Japan
- South Korea
- Australia
- Rest of Asia-Pacific
- South America
- Brazil
- Argentina
- Rest of South America
- Middle East and Africa
- GCC
- South Africa
- Rest of Middle East and Africa
- North America
Geography Analysis
North America generated 41.78% of 2025 revenue due to comprehensive insurance coverage and an early-adopter clinician culture. Biosimilar entry is expected to soften price points but widen access, balancing revenue shifts. Europe follows with entrenched national tender frameworks that negotiate volume-linked discounts, promoting class sustainability. Asia-Pacific posts the highest 16.42% CAGR, driven by China's local production, India's emerging private insurance products, and Japan's expanding indications list. Growing disease recognition and guideline alignment push biologic initiation earlier in patient journeys, accelerating volume capture in the Asia-Pacific interleukin inhibitors market.
Latin American uptake is uneven; Brazil leads adoption through its Unified Health System, while other countries face procurement budget limits. Middle East & Africa show double-digit unit growth off a small base, with GCC reimbursement committees gradually incorporating biologics for psoriasis and rheumatoid arthritis. As tender wins propagate, regional visibility increases, supporting physician familiarity. Overall, geography diversity cushions macro-economic shocks and sustains the interleukin inhibitors market growth curve worldwide.
- Novartis
- Eli Lilly and Company
- Abbvie
- Johnson & Johnson
- Roche
- Amgen
- Sanofi
- Regeneron Pharmaceuticals
- AstraZeneca
- Bristol-Myers Squibb
- UCB
- Boehringer Ingelheim
- Sun Pharmaceuticals Industries
- Biogen
- Celltrion Healthcare
- Samsung Bioepis
- Fresenius
- XBiotech Inc.
- Innovent Biologics
- Akeso Inc.
Additional Benefits:
- The market estimate (ME) sheet in Excel format
- 3 months of analyst support
TABLE OF CONTENTS
1 Introduction
- 1.1 Study Assumptions & Market Definition
- 1.2 Scope of the Study
2 Research Methodology
3 Executive Summary
4 Market Landscape
- 4.1 Market Overview
- 4.2 Market Drivers
- 4.2.1 Escalating prevalence of autoimmune & autoinflammatory diseases
- 4.2.2 Accelerated FDA & EMA approvals for next-gen IL-17/IL-23 biologics
- 4.2.3 Shift toward convenient self-injectable formulations
- 4.2.4 Expanding reimbursement in emerging Asian markets
- 4.2.5 AI-enabled target discovery for novel interleukin pathways (under-the-radar)
- 4.2.6 Clinical success of IL inhibitors in severe COVID-19 cytokine storm (under-the-radar)
- 4.3 Market Restraints
- 4.3.1 High acquisition cost versus small-molecule DMARDs
- 4.3.2 Looming biosimilar competition post-2026
- 4.3.3 Adverse infection-risk profile & black-box warnings
- 4.3.4 Payer preference shifting to step-therapy prior authorizations (under-the-radar)
- 4.4 Value / Supply-Chain Analysis
- 4.5 Regulatory Landscape
- 4.6 Technological Outlook
- 4.7 Porter's Five Forces
- 4.7.1 Threat of New Entrants
- 4.7.2 Bargaining Power of Suppliers
- 4.7.3 Bargaining Power of Buyers
- 4.7.4 Threat of Substitutes
- 4.7.5 Competitive Rivalry
5 Market Size & Growth Forecasts (Value)
- 5.1 By Drug Type
- 5.1.1 IL-1 Inhibitors
- 5.1.2 IL-6 Inhibitors
- 5.1.3 IL-17 Inhibitors
- 5.1.4 IL-23 Inhibitors
- 5.1.5 Multi-target / Others
- 5.2 By Application
- 5.2.1 Psoriasis & Psoriatic Arthritis
- 5.2.2 Rheumatoid Arthritis
- 5.2.3 Inflammatory Bowel Disease (Crohn's & UC)
- 5.2.4 Ankylosing Spondylitis
- 5.2.5 Other Auto-Inflammatory Disorders
- 5.3 By Route of Administration
- 5.3.1 Subcutaneous
- 5.3.2 Intravenous
- 5.4 By End-user
- 5.4.1 Hospitals
- 5.4.2 Specialty Clinics
- 5.4.3 Home-care / Self-administration Programs
- 5.5 By Geography
- 5.5.1 North America
- 5.5.1.1 United States
- 5.5.1.2 Canada
- 5.5.1.3 Mexico
- 5.5.2 Europe
- 5.5.2.1 Germany
- 5.5.2.2 United Kingdom
- 5.5.2.3 France
- 5.5.2.4 Italy
- 5.5.2.5 Spain
- 5.5.2.6 Rest of Europe
- 5.5.3 Asia-Pacific
- 5.5.3.1 China
- 5.5.3.2 India
- 5.5.3.3 Japan
- 5.5.3.4 South Korea
- 5.5.3.5 Australia
- 5.5.3.6 Rest of Asia-Pacific
- 5.5.4 South America
- 5.5.4.1 Brazil
- 5.5.4.2 Argentina
- 5.5.4.3 Rest of South America
- 5.5.5 Middle East and Africa
- 5.5.5.1 GCC
- 5.5.5.2 South Africa
- 5.5.5.3 Rest of Middle East and Africa
- 5.5.1 North America
6 Competitive Landscape
- 6.1 Market Concentration
- 6.2 Market Share Analysis
- 6.3 Company Profiles {(includes Global level Overview, Market level overview, Core Segments, Financials as available, Strategic Information, Market Rank/Share for key companies, Products & Services, and Recent Developments)}
- 6.3.1 Novartis AG
- 6.3.2 Eli Lilly & Co.
- 6.3.3 AbbVie Inc.
- 6.3.4 Johnson & Johnson (Janssen)
- 6.3.5 F. Hoffmann-La Roche AG
- 6.3.6 Amgen Inc.
- 6.3.7 Sanofi S.A.
- 6.3.8 Regeneron Pharmaceuticals
- 6.3.9 AstraZeneca plc
- 6.3.10 Bristol Myers Squibb
- 6.3.11 UCB S.A.
- 6.3.12 Boehringer Ingelheim
- 6.3.13 Sun Pharma
- 6.3.14 Biogen Inc.
- 6.3.15 Celltrion Healthcare
- 6.3.16 Samsung Bioepis
- 6.3.17 Fresenius Kabi
- 6.3.18 XBiotech Inc.
- 6.3.19 Innovent Biologics
- 6.3.20 Akeso Inc.
7 Market Opportunities & Future Outlook
- 7.1 White-space & Unmet-need Assessment

