PUBLISHER: Mordor Intelligence | PRODUCT CODE: 2116462

PUBLISHER: Mordor Intelligence | PRODUCT CODE: 2116462
Occupational And Physical Therapy Services - Market Share Analysis, Industry Trends & Statistics, Growth Forecasts (2026 - 2031)
According to Mordor Intelligence, the occupational and physical therapy services market size was valued at USD 64.46 billion in 2025 and is estimated to grow from USD 70.42 billion in 2026 to reach USD 109.60 billion by 2031, at a CAGR of 9.25% during the forecast period (2026-2031).
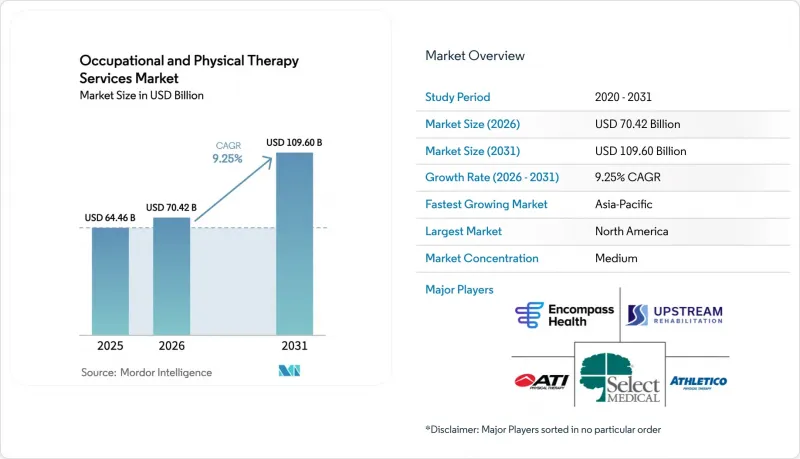
This report is Segmented by Payor (Public Health Insurance, Private Health Insurance, and Out of Pocket), Application (Orthopedic Therapy, General Therapy, and More), Setting (Hospitals, Outpatient Clinics, and More), Service-Delivery Mode (In-Person Therapy, Hybrid Therapy, and More), and Geography (North America, and More). The Market Forecasts are Provided in Terms of Value (USD).
Global Occupational And Physical Therapy Services Market Trends and Insights
Increasing Occupational & Physical-Therapy Workforce
The pipeline of professionals is widening: 12,400 physical therapists and 8,200 occupational therapists graduated in 2024, a 6% and 5% year-over-year increase, respectively. States such as Texas and Florida opened a combined 30 new clinics in 2024, absorbing graduates faster than legacy coastal markets. India's 2025 skills initiative to train 50,000 therapists by 2028 aims to cut the supply lag in tier-2 and tier-3 cities. These workforce gains directly expand addressable capacity, especially in rural and suburban areas where the occupational and physical therapy services market historically suffered staffing shortages. As supply rises, wait-times shrink, bolstering adherence and recurring revenue.
Growing Reimbursement Coverage for Rehabilitative Care
CMS made pandemic-era telehealth parity permanent in its 2024 physician-fee schedule, allowing therapists to bill virtual visits at the same rate as clinic sessions. Private insurers have followed suit; UnitedHealthcare now covers up to 30 virtual sessions per year without prior authorization. Evidence supports that early, guideline-concordant therapy prevents costly surgeries: a Health Care Cost Institute study showed 28% lower lumbar-fusion rates when patients completed eight or more visits within 90 days of diagnosis. Employer adoption is also rising, with Amazon operating on-site therapy clinics in 25 fulfillment centers by 2025.
Low Awareness & Limited Access in Emerging Markets
Only 15% of people in low-income nations who need rehabilitation actually receive it, versus 65% in high-income countries. Sub-Saharan Africa averages 0.04 physical therapists per 10,000 population, compared with 7.2 in North America. India maintains a 1-per-90,000 therapist-to-population ratio. Long travel distances, tuition bottlenecks, and narrow insurance benefits restrain penetration. Government workforce planning and benefit-design reforms are prerequisites for closing this gap, otherwise demand will remain latent.
Other drivers and restraints analyzed in the detailed report include:
- Rising Incidence of Sports & Recreation Injuries
- Aging-Population Driven Musculoskeletal Burden
- High Out-of-Pocket Cost for Long Treatment Cycles
For complete list of drivers and restraints, kindly check the Table Of Contents.
Segment Analysis
Public coverage held 51.56% revenue in 2025, underpinned by Medicare and Medicaid utilization, yet private health insurance is forecast to expand at a 10.25% CAGR through 2031. This acceleration derives from employers bundling musculoskeletal benefits with primary care to mitigate absenteeism. A 2024 National Business Group on Health survey showed 68% of large employers offering virtual physical therapy as a standard benefit. Meanwhile, CMS launched the Rehabilitation Therapy Alternative Payment Model in 2024, enabling shared-savings contracts that reward cost control and functional-outcome gains.
Value-based contracting tilts the competitive field toward data-literate groups able to document functional gains. Anthem now pegs 20% of therapy reimbursement to patient-reported outcome measures. This outcome-linked orientation favors larger platforms with robust analytics and positions the occupational and physical therapy services market for further consolidation.
Orthopedic therapy generated 38.53% of revenue in 2025, benefiting from 1.2 million knee and hip replacements that each trigger 8-12 weeks of rehab. Sports-injury therapy, bolstered by increasing youth participation, is projected to post a 10.85% CAGR through 2031. Neurological therapy gains momentum as hospitals adopt early-mobilization pathways; initiating therapy within 24 hours of stroke lowered average inpatient stay by 2.3 days.
Pediatric therapy growth follows rising autism diagnosis: 1-in-36 U.S. children required specialty services in 2024. Texas Medicaid now funds up to 40 early-intervention sessions yearly, expanding demand. Specialty niches such as pelvic-floor and vestibular programs are emerging add-ons that raise visit frequency and diversify the occupational and physical therapy services market.
Complete Report Scope:
- By Payor
- Public Health Insurance
- Private Health Insurance
- Out-of-Pocket
- By Application
- Orthopedic Therapy
- Neurological Therapy
- Sports-Injury Therapy
- General Therapy
- Geriatric Therapy
- Pediatric Therapy
- Other Applications
- By Setting
- Hospitals
- Outpatient Clinics
- Home-Care Settings
- Other Settings
- By Service-Delivery Mode
- In-person Therapy
- Tele-rehabilitation / Virtual Therapy
- Hybrid Therapy
- By Geography
- North America
- United States
- Canada
- Mexico
- Europe
- Germany
- United Kingdom
- France
- Italy
- Spain
- Rest of Europe
- Asia-Pacific
- China
- India
- Japan
- Australia
- South Korea
- Rest of Asia-Pacific
- Middle East and Africa
- GCC
- South Africa
- Rest of Middle East and Africa
- South America
- Brazil
- Argentina
- Rest of South America
- North America
Geography Analysis
North America contributed 40.13% revenue in 2025, with Medicare spending on outpatient therapy hitting USD 9.8 billion, a 6.2% annual rise driven mainly by volume. Canada's single-payer system covers post-surgical rehab but leaves chronic care largely out-of-pocket, fostering a parallel private clinic sector. Mexico's federal clinics now provide basic therapy, yet most demand remains private, centered in affluent urban corridors. The U.S. Department of Veterans Affairs embedded therapists in 150 community clinics in 2024 to cut veteran wait times.
Asia-Pacific is projected to advance at a 10.51% CAGR through 2031, the fastest worldwide. China's 2024 policy permits therapists to open independent practices, supporting rapid clinic proliferation. India's Apollo Hospitals will introduce 50 rehabilitation centers across tier-2 cities by 2027. Japan confronts labor shortages as its therapist vacancy rate reached 15%, spurring investment in robotic-assist devices. Australia's National Disability Insurance Scheme added AUD 2.1 billion in 2024 funding, enlarging pediatric and neuro-rehab capacity.
Europe maintains steady growth. Germany's statutory plans reimburse up to six sessions per prescription, underpinning predictable outpatient volumes. NHS England's physiotherapy wait times stretched to eight weeks in 2024, propelling private digital alternatives.
- Athletico Physical Therapy
- ATI Holdings LLC
- Concentra Inc.
- CORA Health Services Inc.
- Encompass Health
- FYZICAL Therapy & Balance Centers
- Genesis Rehab Services
- Hinge Health
- Kindred Healthcare
- Knight Health Holdings LLC
- Luna Physical Therapy
- NovaCare Rehabilitation
- PT Solutions
- Select Medical
- SWORD Health
- United States Physical Therapy Inc.
- Upstream Rehabilitation
Additional Benefits:
- The market estimate (ME) sheet in Excel format
- 3 months of analyst support
TABLE OF CONTENTS
1 Introduction
- 1.1 Study Assumptions & Market Definition
- 1.2 Scope of the Study
2 Research Methodology
3 Executive Summary
4 Market Landscape
- 4.1 Market Overview
- 4.2 Market Drivers
- 4.2.1 Increasing occupational & physical-therapy workforce
- 4.2.2 Growing reimbursement coverage for rehabilitative care
- 4.2.3 Rising incidence of sports & recreation injuries
- 4.2.4 Ageing-population driven musculoskeletal burden
- 4.2.5 Hybrid in-person/virtual service models
- 4.2.6 AI-enabled personalized rehab protocols
- 4.3 Market Restraints
- 4.3.1 Low awareness & limited access in emerging markets
- 4.3.2 High out-of-pocket cost for long treatment cycles
- 4.3.3 Data-privacy concerns around tele-rehab platforms
- 4.3.4 Fragmented outcome-tracking standards
- 4.4 Regulatory Landscape
- 4.5 Technological Outlook
- 4.6 Porter's Five Forces
- 4.6.1 Threat of New Entrants
- 4.6.2 Bargaining Power of Buyers
- 4.6.3 Bargaining Power of Suppliers
- 4.6.4 Threat of Substitutes
- 4.6.5 Intensity of Competitive Rivalry
5 Market Size & Growth Forecasts (Value, USD)
- 5.1 By Payor
- 5.1.1 Public Health Insurance
- 5.1.2 Private Health Insurance
- 5.1.3 Out-of-Pocket
- 5.2 By Application
- 5.2.1 Orthopedic Therapy
- 5.2.2 Neurological Therapy
- 5.2.3 Sports-Injury Therapy
- 5.2.4 General Therapy
- 5.2.5 Geriatric Therapy
- 5.2.6 Pediatric Therapy
- 5.2.7 Other Applications
- 5.3 By Setting
- 5.3.1 Hospitals
- 5.3.2 Outpatient Clinics
- 5.3.3 Home-Care Settings
- 5.3.4 Other Settings
- 5.4 By Service-Delivery Mode
- 5.4.1 In-person Therapy
- 5.4.2 Tele-rehabilitation / Virtual Therapy
- 5.4.3 Hybrid Therapy
- 5.5 By Geography
- 5.5.1 North America
- 5.5.1.1 United States
- 5.5.1.2 Canada
- 5.5.1.3 Mexico
- 5.5.2 Europe
- 5.5.2.1 Germany
- 5.5.2.2 United Kingdom
- 5.5.2.3 France
- 5.5.2.4 Italy
- 5.5.2.5 Spain
- 5.5.2.6 Rest of Europe
- 5.5.3 Asia-Pacific
- 5.5.3.1 China
- 5.5.3.2 India
- 5.5.3.3 Japan
- 5.5.3.4 Australia
- 5.5.3.5 South Korea
- 5.5.3.6 Rest of Asia-Pacific
- 5.5.4 Middle East and Africa
- 5.5.4.1 GCC
- 5.5.4.2 South Africa
- 5.5.4.3 Rest of Middle East and Africa
- 5.5.5 South America
- 5.5.5.1 Brazil
- 5.5.5.2 Argentina
- 5.5.5.3 Rest of South America
- 5.5.1 North America
6 Competitive Landscape
- 6.1 Market Concentration
- 6.2 Market Share Analysis
- 6.3 Company Profiles (includes Global-level Overview, Market-level Overview, Core Segments, Financials, Strategic Information, Market Rank/Share, Products & Services, Recent Developments)
- 6.3.1 Athletico Physical Therapy
- 6.3.2 ATI Holdings LLC
- 6.3.3 Concentra Inc.
- 6.3.4 CORA Health Services Inc.
- 6.3.5 Encompass Health Corporation
- 6.3.6 FYZICAL Therapy & Balance Centers
- 6.3.7 Genesis Rehab Services
- 6.3.8 Hinge Health
- 6.3.9 Kindred Healthcare
- 6.3.10 Knight Health Holdings LLC
- 6.3.11 Luna Physical Therapy
- 6.3.12 NovaCare Rehabilitation
- 6.3.13 PT Solutions
- 6.3.14 Select Medical Corporation
- 6.3.15 SWORD Health
- 6.3.16 United States Physical Therapy Inc.
- 6.3.17 Upstream Rehabilitation Inc.
7 Market Opportunities & Future Outlook
- 7.1 White-space & Unmet-Need Assessment

