PUBLISHER: Mordor Intelligence | PRODUCT CODE: 2116562

PUBLISHER: Mordor Intelligence | PRODUCT CODE: 2116562
Chemotherapy-Induced Neutropenia - Market Share Analysis, Industry Trends & Statistics, Growth Forecasts (2026 - 2031)
According to Mordor Intelligence, the chemotherapy-induced neutropenia market size was valued at USD 651.26 million in 2025 and estimated to grow from USD 674.31 million in 2026 to reach USD 801.57 million by 2031, at a CAGR of 3.54% during the forecast period (2026-2031).
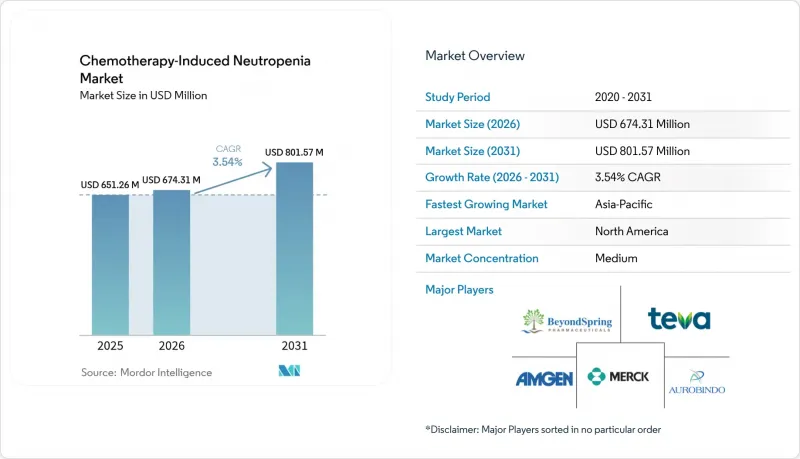
This report is Segmented by Type (Antibiotic Therapy, Granulocyte Colony-Stimulating Factor Therapy, and More), Distribution Channel (Hospital Pharmacies, Retail Pharmacies, and Online Pharmacies), and Geography (North America, Europe, Asia-Pacific, Middle East & Africa, South America). The Market Forecasts are Provided in Terms of Value (USD).
Global Chemotherapy-Induced Neutropenia Market Trends and Insights
Rising Global Cancer Burden
Higher incidence of solid tumors and hematologic malignancies raises demand for prophylactic supportive care. Acute myeloid leukemia treatment protocols that combine venetoclax with conventional 7+3 chemotherapy intensify myelosuppression, leading to more frequent G-CSF use. Aging populations in North America and Europe further enlarge the eligible patient base because elderly individuals carry increased risk for febrile neutropenia. In Asia-Pacific, adoption of Western-style dose-dense regimens expands addressable volumes as oncology capacity scales. Population-based screening programs also detect cancers earlier, allowing more patients to complete multi-cycle chemotherapy that necessitates prophylaxis. The Chemotherapy-Induced Neutropenia market therefore gains steady patient inflow even as overall chemotherapy utilization faces competitive pressure from immunotherapy.
Expanding Access to Biosimilar Growth Factors
Pegfilgrastim biosimilar average selling prices reached USD 2,050 compared with reference products above USD 3,600, reducing payer burden and unlocking treatment for under-insured patients. Streamlined FDA guidance that clarifies analytical similarity testing decreased review cycles by three months in 2024 and encouraged mid-size manufacturers to file abbreviated biologics license applications. Tanvex BioPharma's filgrastim biosimilar won FDA approval and accessed a USD 403 million opportunity, illustrating the potential scale achievable through regulatory excellence. In Europe, interchangeability recommendations simplify substitution in hospital formularies and accelerate hospital tender volumes. Lower unit prices, paired with equivalent efficacy, strengthen the Chemotherapy-Induced Neutropenia market as payers authorize broader prophylaxis coverage.
High Treatment Costs and Reimbursement Gaps
Average hospitalization cost for a febrile neutropenia episode reached USD 35,899 in 2024, placing a heavy burden on health systems. Patients in low-income countries confront out-of-pocket expenses exceeding annual household income. Although biosimilars reduce drug acquisition prices, ancillary costs such as infusion chair time and laboratory monitoring persist. Prior authorization processes delay therapy start by up to four days according to payer audits, potentially heightening infection risk. Charitable foundations fill financial gaps, yet lifetime maximums cap assistance at USD 2,200 per year, well below typical multi-cycle prophylaxis costs. These financial frictions temper the otherwise positive outlook for the Chemotherapy-Induced Neutropenia market.
Other drivers and restraints analyzed in the detailed report include:
- Favorable Clinical Guidelines for Prophylactic G-CSF Use
- Integration of Predictive Analytics for Neutropenia Risk Profiling
- Stringent Regulatory Requirements for Biologics and Biosimilars
For complete list of drivers and restraints, kindly check the Table Of Contents.
Segment Analysis
G-CSF therapy generated the largest Chemotherapy-Induced Neutropenia market size contribution in 2025, accounting for 63.78% of revenues as hospitals adhere to evidence-based prophylaxis protocols. The product class includes filgrastim, pegfilgrastim, and efbemalenograstim alfa, each offering varying half-lives that align with different chemotherapy schedules. Competitive tendering in Europe fostered rapid biosimilar uptake, yet brand loyalty in on-body devices sustains premium segments. Long-acting agents reduce clinic visits and enhance adherence, which positions them favourably in value-based contracts. A pipeline of engineered variants aims to improve receptor affinity without raising bone pain incidence, indicating continued innovation within an already mature class.
Granulocyte transfusion, while niche, records the fastest CAGR at 5.21% through 2031 as gene-edited donor cells and ex-vivo expansion technologies overcome historical supply limitations. Pediatric oncology centres adopt high-dose transfusions for refractory infections that fail to respond to growth factors, thereby carving a unique clinical foothold. Academic collaborations investigate induced pluripotent stem cells to mass-produce functional neutrophils, an advance that could redefine supportive care. Antibiotic therapy remains an indispensable pillar, yet stewardship programs temper volume growth by encouraging de-escalation once cultures clear. Novel prophylactic agents such as trilaciclib aim to pre-empt neutropenia by transiently arresting bone-marrow cell cycling; positive phase III data sets the stage for commercial entry by 2027. Together, these sub-segments ensure a diversified and resilient Chemotherapy-Induced Neutropenia market.
Complete Report Scope:
- By Therapy Type
- Antibiotic Therapy
- Granulocyte Colony-Stimulating Factor (G-CSF) Therapy
- Granulocyte Transfusion
- Other Therapy Types
- By Distribution Channel
- Hospital Pharmacies
- Retail Pharmacies
- Online Pharmacies
- Geography
- North America
- United States
- Canada
- Mexico
- Europe
- Germany
- United Kingdom
- France
- Italy
- Spain
- Rest of Europe
- Asia-Pacific
- China
- Japan
- India
- Australia
- South Korea
- Rest of Asia-Pacific
- Middle East & Africa
- GCC
- South Africa
- Rest of Middle East & Africa
- South America
- Brazil
- Argentina
- Rest of South America
- North America
Geography Analysis
North America delivered the largest regional revenue pool, holding 42.10% share of the chemotherapy-induced neutropenia market in 2025, propelled by broad insurance coverage and early adoption of long-acting biosimilars. Medicare reimbursement supports same-day G-CSF administration for qualifying regimens, which lowers infusion chair utilisation and supports outpatient growth. The region features advanced analytics that integrate electronic health records with risk algorithms, allowing oncologists to personalise prophylactic cycles and limit unnecessary spending. Amgen and Coherus maintain robust commercial infrastructure that secures high formulary presence across US hospital systems, while pharmaceutical benefit managers leverage biosimilar competition to negotiate lower price corridors.
Asia-Pacific represents the fastest expanding territory with a 4.70% CAGR to 2031. China approved Mabwell's Mailisheng injection in 2025, adding a domestically produced long-acting G-CSF that reduces dependence on imports. Uptake of Western-style dose-dense chemotherapy grows across tier-2 cities, boosting prophylaxis volumes. Japan's evidence-anchored guidelines encourage early G-CSF prophylaxis after intensive AML therapy, which solidifies class uptake. India and South-East Asia witness rising biosimilar penetration as government procurement favours cost-effective options for national cancer programmes. Tele-oncology services bridge geographic barriers, making remote G-CSF administration feasible in rural provinces.
Europe maintains a mature yet opportunity-laden environment where tender dynamics foster rapid micro-shifts in share between originators and biosimilars. The EMA approved Ryzneuta in 2024, adding a novel long-acting alternative that lengthens patient dosing intervals. National health services leverage central procurement to drive price deflation, benefiting budget sustainability but compressing margins. Eastern European countries with historically limited access to biologics adopt biosimilars at accelerated rates as reimbursement policies evolve. Latin America, the Middle East, and Africa still account for modest volumes, yet partnership models such as Teva's Global HOPE programme improve paediatric oncology supportive care and lay groundwork for future chemotherapy-induced neutropenia market expansion.
- Amgen
- Pfizer
- Sandoz (Novartis)
- Teva Pharmaceutical Industries
- Merck
- GlaxoSmithKline
- Coherus BioSciences
- Aurobindo Pharma
- Fresenius
- BeyondSpring Pharma
- Kyowa Kirin
- Intas Pharmaceuticals
- Dr. Reddy's Laboratories
- Accord Healthcare
- Viatris
- Hanmi Pharmaceutical
- Apotex
- Mundipharma
- Lupin
- Celltrion
Additional Benefits:
- The market estimate (ME) sheet in Excel format
- 3 months of analyst support
TABLE OF CONTENTS
1 Introduction
- 1.1 Study Assumptions & Market Definition
- 1.2 Scope of the Study
2 Research Methodology
3 Executive Summary
4 Market Landscape
- 4.1 Market Overview
- 4.2 Market Drivers
- 4.2.1 Rising Global Cancer Burden
- 4.2.2 Growing Adoption of Chemotherapy Regimens
- 4.2.3 Expanding Access to Biosimilar Growth Factors
- 4.2.4 Favorable Clinical Guidelines for Prophylactic G-CSF Use
- 4.2.5 Shift Toward Outpatient Oncology Care Models
- 4.2.6 Integration of Predictive Analytics for Neutropenia Risk Profiling
- 4.3 Market Restraints
- 4.3.1 High Treatment Costs and Reimbursement Gaps
- 4.3.2 Stringent Regulatory Requirements for Biologics And Biosimilars
- 4.3.3 Declining Chemotherapy Utilization in Immuno-Oncology Era
- 4.3.4 Manufacturing Capacity Constraints for Biologic APIs
- 4.4 Regulatory Landscape
- 4.5 Porter's Five Forces Analysis
- 4.5.1 Bargaining Power of Buyers
- 4.5.2 Bargaining Power of Suppliers
- 4.5.3 Threat of New Entrants
- 4.5.4 Threat of Substitutes
- 4.5.5 Intensity of Competitive Rivalry
5 Market Size & Growth Forecasts (Value, USD)
- 5.1 By Therapy Type
- 5.1.1 Antibiotic Therapy
- 5.1.2 Granulocyte Colony-Stimulating Factor (G-CSF) Therapy
- 5.1.3 Granulocyte Transfusion
- 5.1.4 Other Therapy Types
- 5.2 By Distribution Channel
- 5.2.1 Hospital Pharmacies
- 5.2.2 Retail Pharmacies
- 5.2.3 Online Pharmacies
- 5.3 Geography
- 5.3.1 North America
- 5.3.1.1 United States
- 5.3.1.2 Canada
- 5.3.1.3 Mexico
- 5.3.2 Europe
- 5.3.2.1 Germany
- 5.3.2.2 United Kingdom
- 5.3.2.3 France
- 5.3.2.4 Italy
- 5.3.2.5 Spain
- 5.3.2.6 Rest of Europe
- 5.3.3 Asia-Pacific
- 5.3.3.1 China
- 5.3.3.2 Japan
- 5.3.3.3 India
- 5.3.3.4 Australia
- 5.3.3.5 South Korea
- 5.3.3.6 Rest of Asia-Pacific
- 5.3.4 Middle East & Africa
- 5.3.4.1 GCC
- 5.3.4.2 South Africa
- 5.3.4.3 Rest of Middle East & Africa
- 5.3.5 South America
- 5.3.5.1 Brazil
- 5.3.5.2 Argentina
- 5.3.5.3 Rest of South America
- 5.3.1 North America
6 Competitive Landscape
- 6.1 Market Concentration
- 6.2 Market Share Analysis
- 6.3 Company Profiles (includes Global level Overview, Market level overview, Core Business Segments, Financials, Headcount, Key Information, Market Rank, Market Share, Products and Services, and analysis of Recent Developments)
- 6.3.1 Amgen, Inc.
- 6.3.2 Pfizer, Inc.
- 6.3.3 Sandoz (Novartis)
- 6.3.4 Teva Pharmaceuticals Industries Ltd.
- 6.3.5 Merck & Co.
- 6.3.6 GlaxoSmithKline
- 6.3.7 Coherus BioSciences
- 6.3.8 Aurobindo Pharma
- 6.3.9 Fresenius Kabi
- 6.3.10 BeyondSpring Pharma
- 6.3.11 Kyowa Kirin
- 6.3.12 Intas Pharmaceuticals
- 6.3.13 Dr. Reddy's Laboratories
- 6.3.14 Accord Healthcare
- 6.3.15 Viatris
- 6.3.16 Hanmi Pharmaceutical
- 6.3.17 Apotex
- 6.3.18 Mundipharma
- 6.3.19 Lupin
- 6.3.20 Celltrion
7 Market Opportunities & Future Outlook
- 7.1 White-Space & Unmet-Need Assessment

