PUBLISHER: Mordor Intelligence | PRODUCT CODE: 2116643

PUBLISHER: Mordor Intelligence | PRODUCT CODE: 2116643
Active And Passive Electronic Components - Market Share Analysis, Industry Trends & Statistics, Growth Forecasts (2026 - 2031)
According to Mordor Intelligence, the active and passive electronic components market size is projected to be USD 0.76 trillion in 2025, USD 0.82 trillion in 2026, and reach USD 1.19 trillion by 2031, growing at a CAGR of 7.73% from 2026 to 2031.
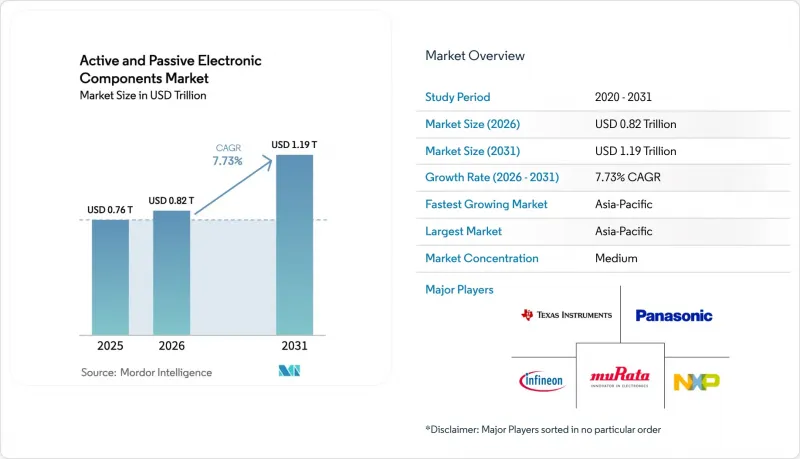
This report is Segmented by Component (Active, and Passive), Mounting Technology (Through-Hole, Surface-Mount, Chip-Scale, and 3D Integrated), Material (Silicon, Gallium Arsenide, Silicon Carbide, and More), End-User Industry (Automotive, Consumer Electronics and Computing, Industrial, Communications, and More), and Geography. The Market Forecasts are Provided in Terms of Value (USD).
Global Active And Passive Electronic Components Market Trends and Insights
Accelerated Adoption of 5G Infrastructure
Radio-frequency front-end modules for 5G macro cells increasingly rely on gallium-nitride power amplifiers above 3.5 GHz where silicon lateral transistors lose more than 20% efficiency. China deployed 3.68 million 5G base stations by 2024 and targets 4.5 million by 2027, sustaining demand for GaN-on-SiC discrete transistors and monolithic microwave integrated circuits. Millimeter-wave spectrum auctions in the United States and Europe opened 24-29 GHz bands and quadrupled antenna-array element counts, inflating passive-component content per radio unit. Ericsson reported an 18% year-over-year increase in radio-unit bill-of-materials costs because of GaN die tightness and organic-substrate shortages. Open-RAN architectures fragment procurement, raising interface-component demand and interoperability risk. To compress lead times, telecom equipment manufacturers colocate GaN epitaxy and module assembly, mirroring the supply-chain strategies adopted in automotive power electronics.
Surge in Automotive Electronics (EVs, ADAS)
Battery-electric vehicles reached 17% of global light-vehicle sales in 2025, and each platform embeds USD 2,000-USD 3,000 worth of semiconductors versus USD 600 in internal-combustion vehicles, according to the Semiconductor Industry Association. Silicon-carbide MOSFETs support 800-V battery packs that cut charging time from 45 minutes to 18 minutes, elevating OEM demand for wide-bandgap substrates. Infineon Technologies posted 23% automotive-segment growth in fiscal 2025 but cited 150-mm wafer bottlenecks that capped shipments. Advanced driver-assistance systems generate 4 TB of data daily, necessitating high-throughput domain controllers and ceramic capacitors rated from -40 °C to 150 °C. European regulations mandating automated emergency braking from 2024 embed a baseline ADAS content per vehicle, anchoring multi-year supply agreements.
Persistent Supply Chain Volatility of Rare-Earth Metals
China controls 70% of refined gallium and 60% of germanium output, and August 2023 export licensing tightened supplies for gallium-arsenide and gallium-nitride epitaxy. Gallium prices climbed 28% between July 2023 and March 2024, forcing non-Chinese foundries to qualify alternative sources at a 15-20% cost premium. Germanium shortages cut non-Chinese supply by 35% in 2024, according to the U.S. Geological Survey. Western governments are subsidizing domestic processing, but environmental permitting means new capacity will not reach scale until at least 2027, leaving a multi-year vulnerability window.
Other drivers and restraints analyzed in the detailed report include:
- Rapid Expansion of Data Centers and Cloud Workloads
- Government Incentives for On-Shore Semiconductor Manufacturing
- Rising IP-Related Litigation and Licensing Costs
For complete list of drivers and restraints, kindly check the Table Of Contents.
Segment Analysis
The active and passive electronic components market size attributed to active devices is forecast to rise at an 8.24% CAGR through 2031, outstripping the broader market. Active power-management ICs for 48-V mild-hybrid and 800-V battery-electric vehicles integrate gate drivers, current sensors, and protection logic, shrinking board area by 40% while enhancing electromagnetic compatibility. Gallium-nitride high-electron-mobility transistors switch above 1 MHz in AI server power supplies, enabling 3 kW L-1 densities that liquid-cooling racks require.
Passive devices still dominate value in consumer electronics, holding a 57.12% share in 2025, but supply risk is growing. Multi-layer ceramic capacitor shortages in 2024 forced automotive OEMs to redesign battery-management systems with lower capacitance totals. Murata and TDK lifted X7R and C0G capacity by 15% in 2025, though yield on 0201 capacitors above 100 µF remains below 75%. Consolidation continued when Yageo acquired Chilisin, creating a vertically integrated passive group that can command premiums of 10-15% for assured supply.
Surface-mount solutions retained a 63.06% slice of the active and passive electronic components market in 2025 thanks to mature pick-and-place automation. However, 3D integrated packaging is expected to post an 8.88% CAGR through 2031 as chiplet frameworks lower design risk. Intel's Foveros and TSMC's system-on-integrated-chips platforms bond dies at 10 µm pitch, cutting latency by 30% compared with interposer-based 2.5D alternatives.
Through-hole technology lingers in aerospace and industrial controls where mechanical shock remains high, but IPC-6012 Class 3 boards now qualify 0.4 mm-pitch BGAs that approach the robustness of old-style pins. Chip-scale packages under 0.5 mm height are popular in wearables, yet thermal constraints limit power to 500 mW, restricting adoption for processors. The migration from wire bonding to flip-chip bumping improved electrical performance but added moisture sensitivity, increasing assembly cycle time by up to six hours.
Complete Report Scope:
- By Component
- Active Components
- Passive Components
- By Mounting Technology
- Through-Hole Technology
- Surface-Mount Technology
- Chip-Scale Package
- 3D Integrated Packaging
- By Material
- Silicon
- Gallium Arsenide
- Silicon Carbide
- Gallium Nitride
- Other Materials
- By End-User Industry
- Automotive
- Consumer Electronics and Computing
- Industrial
- Communications
- Medical
- Aerospace and Defense
- Energy and Utilities
- By Geography
- North America
- United States
- Canada
- Mexico
- Europe
- United Kingdom
- Germany
- France
- Italy
- Rest of Europe
- Asia-Pacific
- China
- Japan
- India
- South Korea
- Rest of Asia
- Middle East
- Israel
- Saudi Arabia
- United Arab Emirates
- Turkey
- Rest of Middle East
- Africa
- South Africa
- Egypt
- Rest of Africa
- South America
- Brazil
- Argentina
- Rest of South America
- North America
Geography Analysis
Asia Pacific captured 46.14% of the active and passive electronic components market in 2025, driven by China's assembly dominance, South Korea's memory leadership, and Taiwan's foundry ecosystem. Yet over-reliance on a single region triggered diversification. The United Arab Emirates, through Mubadala, bought the remaining GlobalFoundries stake in 2024 and pledged USD 10 billion to add 22-nm automotive capacity, positioning the UAE as a regional fabrication hub. Saudi Arabia's Public Investment Fund formed a semiconductor design center with Arm in 2025, part of a strategy that propels Middle East growth at an 8.35% CAGR.
North America and Europe rely on subsidy programs, but tool delivery and skilled-labour shortages have pushed first-wafer milestones into 2027-2028. China accelerated trailing-edge capacity by 35% in 2024 after U.S. export controls on EUV tools, targeting automotive and industrial nodes at 28-40 nm. Japan's rebound hinges on TSMC's Kumamoto fab and Rapidus's 2-nm partnership with IBM; success depends on talent pipelines and localized chemicals.
South America and Africa remain nascent, focusing on low-complexity assemblies like power supplies and lighting. India's electronics-manufacturing services expanded 22% in 2025 under smartphone-assembly incentives, yet wafer-fab projects remain under construction and will not yield output until late 2026.
- Infineon Technologies AG
- NXP Semiconductors NV
- Texas Instruments Inc.
- Panasonic Corporation
- Murata Manufacturing Co. Ltd.
- Eaton Corporation
- TE Connectivity Ltd.
- Honeywell International Inc.
- Toshiba Corporation
- Vishay Intertechnology Inc.
- YAGEO Corporation
- TDK Corporation
- KEMET Corporation
- AVX Corporation
- Lelon Electronics Corporation
- Taiyo Yuden Co. Ltd.
- STMicroelectronics NV
- Analog Devices, Inc.
- Broadcom Inc.
- Samsung Electronics Co. Ltd.
- Omron Corporation
Additional Benefits:
- The market estimate (ME) sheet in Excel format
- 3 months of analyst support
TABLE OF CONTENTS
1 INTRODUCTION
- 1.1 Study Assumptions and Market Definition
- 1.2 Scope of the Study
2 RESEARCH METHODOLOGY
3 EXECUTIVE SUMMARY
4 MARKET LANDSCAPE
- 4.1 Market Overview
- 4.2 Market Drivers
- 4.2.1 Accelerated Adoption of 5G Infrastructure
- 4.2.2 Shrinking Form-Factor Requirements in Wearables and IoT Devices
- 4.2.3 Surge in Automotive Electronics (EVs, ADAS)
- 4.2.4 Rapid Expansion of Data Centers and Cloud Workloads
- 4.2.5 Government Incentives for On-Shore Semiconductor Manufacturing
- 4.2.6 Emerging Demand for Quantum-Ready Cryogenic Components
- 4.3 Market Restraints
- 4.3.1 Persistent Supply Chain Volatility of Rare-Earth Metals
- 4.3.2 Rising IP-Related Litigation and Licensing Costs
- 4.3.3 Environmental Compliance Costs for Lead-Free Soldering
- 4.3.4 Skills Gap in Advanced Packaging Technologies
- 4.4 Industry Value-Chain Analysis
- 4.5 Impact of Macroeconomic Factors on the Market
- 4.6 Regulatory Landscape
- 4.7 Technological Outlook
- 4.8 Porter's Five Forces Analysis
- 4.8.1 Bargaining Power of Suppliers
- 4.8.2 Bargaining Power of Consumers
- 4.8.3 Threat of New Entrants
- 4.8.4 Intensity of Competitive Rivalry
- 4.8.5 Threat of Substitutes
5 MARKET SIZE AND GROWTH FORECASTS (VALUE)
- 5.1 By Component
- 5.1.1 Active Components
- 5.1.2 Passive Components
- 5.2 By Mounting Technology
- 5.2.1 Through-Hole Technology
- 5.2.2 Surface-Mount Technology
- 5.2.3 Chip-Scale Package
- 5.2.4 3D Integrated Packaging
- 5.3 By Material
- 5.3.1 Silicon
- 5.3.2 Gallium Arsenide
- 5.3.3 Silicon Carbide
- 5.3.4 Gallium Nitride
- 5.3.5 Other Materials
- 5.4 By End-User Industry
- 5.4.1 Automotive
- 5.4.2 Consumer Electronics and Computing
- 5.4.3 Industrial
- 5.4.4 Communications
- 5.4.5 Medical
- 5.4.6 Aerospace and Defense
- 5.4.7 Energy and Utilities
- 5.5 By Geography
- 5.5.1 North America
- 5.5.1.1 United States
- 5.5.1.2 Canada
- 5.5.1.3 Mexico
- 5.5.2 Europe
- 5.5.2.1 United Kingdom
- 5.5.2.2 Germany
- 5.5.2.3 France
- 5.5.2.4 Italy
- 5.5.2.5 Rest of Europe
- 5.5.3 Asia-Pacific
- 5.5.3.1 China
- 5.5.3.2 Japan
- 5.5.3.3 India
- 5.5.3.4 South Korea
- 5.5.3.5 Rest of Asia
- 5.5.4 Middle East
- 5.5.4.1 Israel
- 5.5.4.2 Saudi Arabia
- 5.5.4.3 United Arab Emirates
- 5.5.4.4 Turkey
- 5.5.4.5 Rest of Middle East
- 5.5.5 Africa
- 5.5.5.1 South Africa
- 5.5.5.2 Egypt
- 5.5.5.3 Rest of Africa
- 5.5.6 South America
- 5.5.6.1 Brazil
- 5.5.6.2 Argentina
- 5.5.6.3 Rest of South America
- 5.5.1 North America
6 COMPETITIVE LANDSCAPE
- 6.1 Market Concentration
- 6.2 Strategic Moves
- 6.3 Market Share Analysis
- 6.4 Company Profiles (includes Global level Overview, Market level overview, Core Segments, Financials as available, Strategic Information, Market Rank/Share for key companies, Products and Services, and Recent Developments)
- 6.4.1 Infineon Technologies AG
- 6.4.2 NXP Semiconductors NV
- 6.4.3 Texas Instruments Inc.
- 6.4.4 Panasonic Corporation
- 6.4.5 Murata Manufacturing Co. Ltd.
- 6.4.6 Eaton Corporation
- 6.4.7 TE Connectivity Ltd.
- 6.4.8 Honeywell International Inc.
- 6.4.9 Toshiba Corporation
- 6.4.10 Vishay Intertechnology Inc.
- 6.4.11 YAGEO Corporation
- 6.4.12 TDK Corporation
- 6.4.13 KEMET Corporation
- 6.4.14 AVX Corporation
- 6.4.15 Lelon Electronics Corporation
- 6.4.16 Taiyo Yuden Co. Ltd.
- 6.4.17 STMicroelectronics NV
- 6.4.18 Analog Devices, Inc.
- 6.4.19 Broadcom Inc.
- 6.4.20 Samsung Electronics Co. Ltd.
- 6.4.21 Omron Corporation
7 MARKET OPPORTUNITIES AND FUTURE OUTLOOK
- 7.1 White-Space and Unmet-Need Assessment

