PUBLISHER: Mordor Intelligence | PRODUCT CODE: 2116857

PUBLISHER: Mordor Intelligence | PRODUCT CODE: 2116857
Aerospace Pressure Gauge - Market Share Analysis, Industry Trends & Statistics, Growth Forecasts (2026 - 2031)
According to Mordor Intelligence, the aerospace pressure gauge market size in 2026 is estimated at USD 23.03 million, growing from 2025 value of USD 22.57 million with 2031 projections showing USD 25.43 million, growing at 2.02% CAGR over 2026-2031.
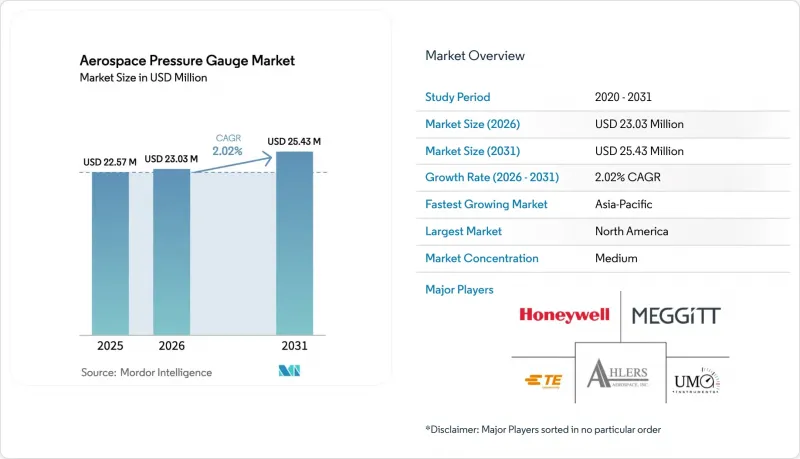
This report is Segmented by Gauge Type (Analog, Digital, and Others), Application (Aviation and Space), Aircraft System (Fuel System, Hydraulics System, and More), Pressure Sensor Technology (Piezoresistive, Capacitive, and Piezoelectric), and Geography (North America, Europe, and More). The Market Forecasts are Provided in Terms of Value (USD).
Global Aerospace Pressure Gauge Market Trends and Insights
Acceleration In Digital Cockpit Modernization Initiatives
Airframers are migrating from mechanical dials toward integrated flight decks that consolidate pressure data on glass displays. Honeywell's Avianca A320neo retrofit replaced 14 analog gauges with six digital units, reducing cockpit weight by 8 kg and enabling health monitoring through Skywise analytics. The B787 and B777X require digital sensors across fuel, hydraulic, and environmental systems, pressuring MROs to carry electronic spares. Embraer's E2 jets demand sub-0.1% full-scale accuracy delivered via CAN bus, which mechanical Bourdon tubes cannot maintain over wide thermal ranges. Lessors are funding mid-life narrowbody upgrades to sustain lease rates, accelerating the retirement of analog aircraft even on those with 10-year service lives. FAA Advisory Circular 25-11B now streamlines approval of digital instrumentation, further reinforcing the adoption cycle.
Increasing Integration Of Wireless Pressure Monitoring Systems In Commercial Fleets
Teledyne's 2024 Bluetooth Low Energy module eliminated 200 m of wiring per aircraft and cut installation labor by 40 hours. Weight savings of roughly 12 kg per narrowbody translate into fuel burn reductions and lower carbon charges. Airbus Skywise aggregates real-time sensor data from more than 10,000 aircraft, and early anomaly alerts prevented three in-flight shutdowns on an Asian A330 fleet in 2024. EASA requires DO-160G emission compliance and fail-safe modes for wireless links, which can add up to nine months to certification, but ensures reliability. Operators prioritize tire-pressure modules that shorten ground checks by up to 20 minutes and reduce incidents of tread separation.
Performance Limitations Associated With Mechanical Gauge Reliability
Analog Bourdon-tube gauges drift 0.5% to 1.0% per year and contributed 18% of unscheduled maintenance events on regional turboprops in 2024. Temperature sensitivity can cause errors exceeding 3% at cruise altitude, whereas digital sensors compensate algorithmically. Complete retrofits cost between USD 15,000 and USD 25,000 per aircraft, deterring operators of older assets. Mechanical units also require 500-hour inspections, compared to 2,000 hours for digital equivalents, which increases lifecycle expenses by roughly 40%. Operators weigh known shortcomings against capital outlay, slowing the fleet-wide update pace.
Other drivers and restraints analyzed in the detailed report include:
- Expansion In Global Aerospace Manufacturing And Assembly Capacity
- Regulatory Compliance Mandates Enforcing Strict Calibration And Maintenance Cycles
- Elevated Certification And Regulatory Approval Costs For Advanced Sensor Technologies
For complete list of drivers and restraints, kindly check the Table Of Contents.
Segment Analysis
Analog instruments accounted for 55.92% of the aerospace pressure gauge market share in 2025, reflecting their legacy footprint across older narrowbodies and turboprops. Digital gauges, supported by airframe policies on integrated avionics, are forecast to grow at a rate of 3.12% annually to 2031, progressively displacing mechanical units in both linefit and retrofit channels.
Digital architectures simplify wiring, enable remote diagnostics, and meet new cybersecurity rules, tipping total cost-of-ownership in their favor by delivering a three-year payback through reduced calibration labor and fewer unscheduled interventions. The growth in market share of digital pressure gauges is envisioned to be aided by FAA incentives for software-based displays. Analog remains relevant in military programs that still specify mechanical backups, but its revenue pool steadily narrows as fleets modernize.
Aviation accounted for 92.85% of 2025 revenue, with commercial air transport leading unit demand as Airbus and Boeing boost single-aisle production. Military and business aviation add volume through modernization programs that embed digital sensors for condition-based maintenance. The aerospace pressure gauge market size in aviation applications is expected to grow at a 4.05% CAGR by 2031.
Spacecraft and satellite platforms, although smaller in dollars, display above-average growth as Artemis lunar missions, LEO constellations, and JAXA's exploration projects adopt radiation-hardened gauges. Redundant capacitive sensors on SpaceX Dragon capsules set new performance benchmarks and guide specifications for future orbital stations. While space represents under 7% of current sales, its higher margins and technology spillovers give suppliers a strategic incentive to invest.
Complete Report Scope:
- By Gauge Type
- Analog
- Digital
- Others
- By Application
- Aviation
- Commercial Aviation
- Military Aviation
- General Aviation
- Unmannned Aerial Systems
- Space
- Satellite
- Spacecraft
- Aviation
- By Aircraft System
- Fuel System
- Hydraulics System
- Cabin Pressure and ECS
- Engine and APU Monitoring System
- Landing-Gear and Tire Pressure Monitoring System
- Avionics/Pitot-Static
- Pneumatic Systems
- By Pressure Sensor Technology
- Piezoresistive
- Capacitive
- Piezoelectric
- By Geography
- North America
- United States
- Canada
- Mexico
- Europe
- United Kingdom
- France
- Germany
- Italy
- Spain
- Rest of Europe
- Asia-Pacific
- China
- India
- Japan
- South Korea
- Rest of Asia-Pacific
- South America
- Brazil
- Argentina
- Rest of South America
- Middle East and Africa
- Middle East
- United Arab Emirates
- Saudi Arabia
- Turkey
- Rest of Middle East
- Africa
- South Africa
- Rest of Africa
- Middle East
- North America
Geography Analysis
North America led with 37.25% revenue in 2025, supported by Boeing's production hubs, Airbus's Alabama line, and a dense network of Tier 1 suppliers. Proximity to the FAA and RTCA accelerates certification, giving domestic vendors early access to new standards and program slots. US defense projects such as the KC-46 tanker and B-21 bomber sustain demand for 40-G shock-qualified, 10,000-hour mean time between failures (MTBF) sensors. Canada contributes through Bombardier upgrades, while Mexico's low-cost sub-assembly capability supports local growth.
The Asia-Pacific is the fastest-growing cluster, with a 5.59% CAGR, driven by COMAC's C919 ramp, India's C295 transport line, and high-tempo fleet expansion at low-cost carriers. China's 70% domestic content mandate catalyzes joint ventures such as Safran-AVIC Jonhon's Luoyang plant for piezoresistive output. India's Tejas and HTT-40 programs intensify indigenous demand; meanwhile, Japan's JAXA drives the development of cryogenic and radiation-hardened sensors. South Korea and Southeast Asian nations add incremental volume through urban air mobility (UAM) pilots.
Europe maintains a robust share, anchored by Airbus assemblies in Toulouse, Hamburg, and Seville, as well as suppliers such as Safran and Parker Meggitt. EASA's stringent Part-21 requirements lengthen the time-to-market yet ensure high-quality thresholds that favor established players. Sustainability themes, including Airbus's ZEROe hydrogen demonstrator, spur requests for gauges capable of operating at -253 °C. The Middle East is leveraging the growth of MRO hubs in Dubai and Abu Dhabi. In contrast, Africa and South America remain comparatively small due to limited manufacturing of high-reliability sensors.
- UMA, Inc.
- Ahlers Aerospace, Inc.
- L3Harris Technologies, Inc.
- Davtron Inc.
- Honeywell International Inc.
- Parker Meggitt (Parker-Hannifin Corporation)
- TE Connectivity plc
- Baker Hughes Company
- CIRCOR International, Inc.
- Newbow Aerospace Ltd.
- PCB Piezotronics, Inc.
- Tronair Inc.
- WIKA Instrument, LP
Additional Benefits:
- The market estimate (ME) sheet in Excel format
- 3 months of analyst support
TABLE OF CONTENTS
1 INTRODUCTION
- 1.1 Study Assumptions and Market Definition
- 1.2 Scope of the Study
2 RESEARCH METHODOLOGY
3 EXECUTIVE SUMMARY
4 MARKET LANDSCAPE
- 4.1 Market Overview
- 4.2 Market Drivers
- 4.2.1 Acceleration in digital cockpit modernization initiatives
- 4.2.2 Increasing integration of wireless pressure monitoring systems in commercial fleets
- 4.2.3 Expansion in global aerospace manufacturing and assembly capacity
- 4.2.4 Regulatory compliance mandates enforcing strict calibration and maintenance cycles
- 4.2.5 Technological advancements in MEMS-based miniaturized pressure sensors
- 4.2.6 Growth in unmanned aerial systems requiring compact and high-precision instrumentation
- 4.3 Market Restraints
- 4.3.1 Performance limitations associated with mechanical gauge reliability
- 4.3.2 Elevated certification and regulatory approval costs for advanced sensor technologies
- 4.3.3 Material sourcing challenges impacting high-grade sensor component availability
- 4.3.4 Cybersecurity compliance requirements delaying deployment of connected gauge systems
- 4.4 Value Chain Analysis
- 4.5 Regulatory Landscape
- 4.6 Technological Outlook
- 4.7 Porter's Five Forces Analysis
- 4.7.1 Bargaining Power of Buyers
- 4.7.2 Bargaining Power of Suppliers
- 4.7.3 Threat of New Entrants
- 4.7.4 Threat of Substitutes
- 4.7.5 Intensity of Competitive Rivalry
5 MARKET SIZE AND GROWTH FORECASTS (VALUE)
- 5.1 By Gauge Type
- 5.1.1 Analog
- 5.1.2 Digital
- 5.1.3 Others
- 5.2 By Application
- 5.2.1 Aviation
- 5.2.1.1 Commercial Aviation
- 5.2.1.2 Military Aviation
- 5.2.1.3 General Aviation
- 5.2.1.4 Unmannned Aerial Systems
- 5.2.2 Space
- 5.2.2.1 Satellite
- 5.2.2.2 Spacecraft
- 5.2.1 Aviation
- 5.3 By Aircraft System
- 5.3.1 Fuel System
- 5.3.2 Hydraulics System
- 5.3.3 Cabin Pressure and ECS
- 5.3.4 Engine and APU Monitoring System
- 5.3.5 Landing-Gear and Tire Pressure Monitoring System
- 5.3.6 Avionics/Pitot-Static
- 5.3.7 Pneumatic Systems
- 5.4 By Pressure Sensor Technology
- 5.4.1 Piezoresistive
- 5.4.2 Capacitive
- 5.4.3 Piezoelectric
- 5.5 By Geography
- 5.5.1 North America
- 5.5.1.1 United States
- 5.5.1.2 Canada
- 5.5.1.3 Mexico
- 5.5.2 Europe
- 5.5.2.1 United Kingdom
- 5.5.2.2 France
- 5.5.2.3 Germany
- 5.5.2.4 Italy
- 5.5.2.5 Spain
- 5.5.2.6 Rest of Europe
- 5.5.3 Asia-Pacific
- 5.5.3.1 China
- 5.5.3.2 India
- 5.5.3.3 Japan
- 5.5.3.4 South Korea
- 5.5.3.5 Rest of Asia-Pacific
- 5.5.4 South America
- 5.5.4.1 Brazil
- 5.5.4.2 Argentina
- 5.5.4.3 Rest of South America
- 5.5.5 Middle East and Africa
- 5.5.5.1 Middle East
- 5.5.5.1.1 United Arab Emirates
- 5.5.5.1.2 Saudi Arabia
- 5.5.5.1.3 Turkey
- 5.5.5.1.4 Rest of Middle East
- 5.5.5.2 Africa
- 5.5.5.2.1 South Africa
- 5.5.5.2.2 Rest of Africa
- 5.5.5.1 Middle East
- 5.5.1 North America
6 COMPETITIVE LANDSCAPE
- 6.1 Market Concentration
- 6.2 Strategic Moves
- 6.3 Market Share Analysis
- 6.4 Company Profiles (includes Global level Overview, Market level overview, Core Segments, Financials as available, Strategic Information, Market Rank/Share for key companies, Products and Services, and Recent Developments)
- 6.4.1 UMA, Inc.
- 6.4.2 Ahlers Aerospace, Inc.
- 6.4.3 L3Harris Technologies, Inc.
- 6.4.4 Davtron Inc.
- 6.4.5 Honeywell International Inc.
- 6.4.6 Parker Meggitt (Parker-Hannifin Corporation)
- 6.4.7 TE Connectivity plc
- 6.4.8 Baker Hughes Company
- 6.4.9 CIRCOR International, Inc.
- 6.4.10 Newbow Aerospace Ltd.
- 6.4.11 PCB Piezotronics, Inc.
- 6.4.12 Tronair Inc.
- 6.4.13 WIKA Instrument, LP
7 MARKET OPPORTUNITIES AND FUTURE OUTLOOK
- 7.1 White-space and Unmet-Need Assessment

