PUBLISHER: Mordor Intelligence | PRODUCT CODE: 2117604

PUBLISHER: Mordor Intelligence | PRODUCT CODE: 2117604
Customer Feedback Software - Market Share Analysis, Industry Trends & Statistics, Growth Forecasts (2026 - 2031)
According to Mordor Intelligence, the customer feedback software market size was USD 4.38 billion in 2025 and is forecast to reach USD 10.71 billion by 2031, growing at a CAGR of 16.50% during 2026-2031.
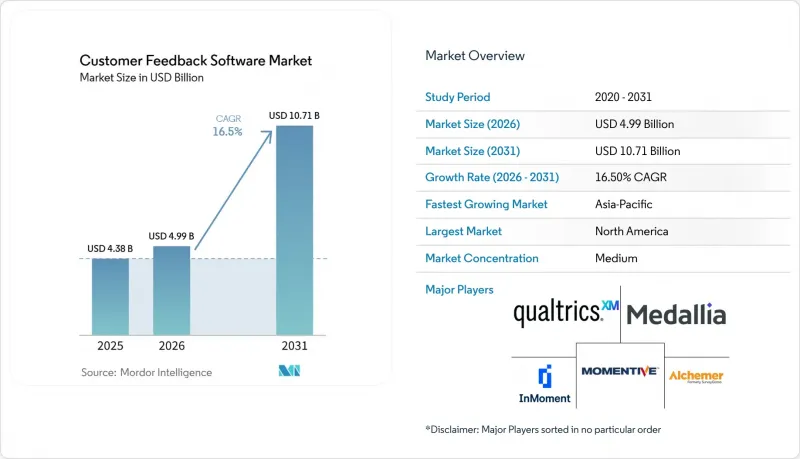
This report is Segmented by Component (Software, and Services), Feedback Collection Channel (Websites and Web Applications, Mobile Applications, and More), Deployment Mode (Cloud, On-Premise, and Hybrid), Application (Voice of Customer Management, and More), End User (IT and Telecom, Healthcare and Life Sciences, and More), and Geography. The Market Forecasts are Provided in Terms of Value (USD).
Global Customer Feedback Software Market Trends and Insights
Continuous Omnichannel Voice-of-Customer Programs
Enterprise customer experience programs increasingly collect signals from websites, mobile apps, contact centers, social media, and in-product interfaces. This approach gives teams a more complete view of a customer journey than a survey sent after a single interaction. The customer feedback software market is therefore moving away from isolated survey tools toward platforms that bring together multiple data types. Buyers are seeking fewer systems with broader capabilities, which can increase both contract scope and contract duration. Unified platforms can combine requested feedback, public social comments, and behavioral signals into a single view. This makes it harder for vendors with disconnected point products to compete for large enterprise deployments.
AI-Based Analysis of Unstructured Feedback
Open-ended survey comments, transcripts, social posts, and chat records were difficult to use at scale when review depended on manual effort. AI-based analysis now allows organizations to classify, summarize, and route those records more quickly. This allows teams to work with a larger share of feedback that was previously left outside formal analysis. Faster processing can also shorten the time between a customer signal and a possible operational response. The customer feedback software market is placing greater value on data sets that can support useful analysis for specific sectors, rather than generic sentiment results. The ability to identify service problems in healthcare, retail, and banking will depend on both model quality and the data available to train it.
Data Privacy and Consent Management Complexity
Broader feedback collection brings together data such as conversation transcripts, behavioral records, health information, and financial interaction details. That creates greater responsibility for vendors and users regarding consent and data handling. GDPR, the California Consumer Privacy Act, and related state laws, and India's Digital Personal Data Protection Act impose different requirements for collecting and managing personal data. Cisco found that 95% of consumers would not buy from a provider that did not protect their data properly. The customer feedback software market faces additional pressure because AI models benefit from long-running datasets, while privacy rules may require data minimization and limited retention. Compliance evidence, including ISO 27001 practices and processor obligations, can determine whether a vendor reaches technical evaluation in healthcare and financial services.
Other drivers and restraints analyzed in the detailed report include:
- Integration of Feedback With Customer Experience Workflows
- Rising Adoption of Cloud Software by Small and Medium-Sized Enterprises
- Survey Fatigue and Declining Response Quality
For complete list of drivers and restraints, kindly check the Table Of Contents.
Segment Analysis
Software accounted for 74.18% of the customer feedback software market share in 2025. The segment includes survey design and distribution tools, feedback collection systems, Voice of Customer platforms, analysis and reporting products, and workflow and case management functions. Organizations have focused spending on systems that convert large volumes of feedback into structured information for operating teams. Voice of Customer management and data analysis products were important areas of enterprise investment in 2025. These tools help companies organize feedback received across multiple channels. They can also identify recurring service issues that might be missed when customer comments sit in separate systems. Reporting functions make it easier for teams to compare input from different locations, channels, or customer groups. Workflow and case management functions then help assign a response to the appropriate operational team. The value of software depends not only on collection capacity, but also on whether users can apply the resulting information.
Services are projected to expand at a 19.24% CAGR from 2026 to 2031. Growth reflects the work required to connect feedback applications with customer relationship management, enterprise resource planning, and service management systems. A feedback deployment often requires data design, workflow configuration, change management, and ongoing support. Stanford Health Care's program combined 600,000 survey responses with operational data sources, which illustrates that large projects extend beyond survey configuration. The work can include defining how teams classify feedback, where information is stored, and which events trigger alerts. Organizations also need to decide which customer issues need a direct response and which should inform broader service improvements. Professional services can help align these decisions with existing business processes. Vendors that package professional services with subscriptions can support larger starting contracts and longer customer relationships. This model also makes integrated platforms harder to replace than simple survey products.
Websites and web applications held 28.41% of the customer feedback software market share in 2025. They benefit from established embedding methods and wide compatibility with web analytics and testing tools. Website collection remains useful because it can capture feedback during browsing, service, and transaction journeys. Feedback can be requested after a purchase, during a support journey, or when a visitor leaves a page without completing an action. This broad coverage makes web collection relevant to many organizations, regardless of their primary customer channel. Mobile applications also provide an important setting for feedback, where customers interact on their phones. Social media and review platforms extend listening beyond the organization's owned channels. Those sources can highlight issues that customers may not report in a formal survey. Each channel adds a different context that can improve the understanding of customer concerns.
In-product interfaces are projected to grow at a 20.83% CAGR from 2026 to 2031. These tools request feedback while a user is actively using a product, avoiding the delay created by an external email invitation. This makes the response more closely connected to a specific feature, task, or point of friction. Pendo stated that in-app survey delivery can generate up to a 1,300% increase in responses compared with email-only programs. Physical locations and kiosks serve a different need in retail, airports, and healthcare settings where anonymous, immediate input can be useful. These physical systems can capture a reaction before the customer leaves the location or forgets the experience. Unison Retail Management used HappyOrNot Smiley Sign devices across more than 180 concessions at Chicago O'Hare International Airport. The deployment collected more than 23,000 feedback interactions in its first 6 months. The customer feedback software industry will need to support consistent analysis across these varied collection settings.
Complete Report Scope:
- By Component
- Software
- Survey Design and Distribution Tools
- Omnichannel Feedback Collection Solutions
- Voice of Customer (VoC) Management Platforms
- Data Analysis and Reporting Tools
- Feedback Workflow and Case Management Software
- Services
- Software
- By Feedback Collection Channel
- Websites and Web Applications
- Mobile Applications
- Contact Centers
- Social Media and Review Platforms
- In-Product Interfaces
- Physical Locations and Kiosks
- By Deployment Mode
- Cloud
- On-Premise
- Hybrid
- By Application
- Voice of Customer (VoC) Management
- Product Experience Management
- Brand and Reputation Management
- Customer Service Quality Management
- Customer Research and Market Validation
- Customer Retention and Churn Prevention
- By End User
- IT and Telecommunication
- BFSI
- Healthcare and Life Sciences
- Retail and E-Commerce
- Industrial Manufacturing
- Education and Research Institutions
- Media and Entertainment
- Government and Administration
- Travel and Hospitality
- Other End Users
- By Geography
- North America
- United States
- Canada
- Mexico
- South America
- Brazil
- Argentina
- Rest of South America
- Europe
- Germany
- United Kingdom
- France
- Russia
- Spain
- Rest of Europe
- Asia-Pacific
- China
- Japan
- India
- South Korea
- Southeast Asia
- Rest of Asia-Pacific
- Middle East and Africa
- Middle East
- Saudi Arabia
- United Arab Emirates
- Rest of Middle East
- Africa
- South Africa
- Nigeria
- Rest of Africa
- Middle East
- North America
Geography Analysis
North America held 34.62% of the customer feedback software market share in 2025. The region has mature enterprise software purchasing, a concentrated vendor base, and broad adoption of customer experience across retail, healthcare, and financial services. The United States accounts for much of the regional demand because large enterprises deploy feedback platforms across several business units and customer channels. Canada is increasingly adopting cloud-based solutions in financial services and government administration, where organizations need to organize digital service feedback. Mexico is becoming a deployment location as retailers and manufacturers standardize customer experience programs across North American operations. The region's installed base and long renewal cycles continue to support its leading position even as growth moderates relative to Asia-Pacific and South America.
Asia-Pacific is projected to grow at a 19.68% CAGR from 2026 to 2031. Genesys reported that 44% of customer experience organizations in the region use agentic AI-powered virtual agents, compared with a global average of 41%. China, India, Japan, South Korea, and Southeast Asia provide the main growth base, although their operating conditions differ. China favors local providers and global vendors that can localize products, while India's Digital Personal Data Protection Act increases demand for consent-aware architectures. Southeast Asia's mobile-first users support demand for in-product and mobile feedback collection. Japan and South Korea support analytics-focused deployments, while Australia provides a testing ground for AI-based feedback capabilities.
Europe had meaningful demand in 2025, with Germany, the United Kingdom, and France as important enterprise deployment markets. GDPR requires strong consent management, data minimization, audit trails, and data residency options, which affect both procurement and product design. South America is expanding through Brazil and Argentina, particularly in retail, banking, and telecommunications, with localization requirements influencing vendor choice. The Middle East and Africa present early-stage opportunities as Saudi Arabia and the United Arab Emirates invest in digital infrastructure for government, retail, and financial services. South Africa and Nigeria have more established enterprise software adoption, while growing mobile connectivity can support broader feedback collection across Africa during the forecast period.
- Qualtrics International Inc.
- Medallia, Inc.
- Momentive Inc.
- Alchemer LLC
- Zoho Corporation Private Limited
- Typeform S.L.
- SurveySparrow Inc.
- Sogolytics LLC
- QuestionPro Inc.
- Survicate Sp. z o.o.
- AskNicely, Inc.
- UserVoice, Inc.
- InMoment, Inc.
- Mopinion B.V.
- Zonka Technologies Private Limited
- SmartSurvey Limited
- Snap Surveys Limited
- LimeSurvey GmbH
- WorldAPP, Inc.
- SurveyLegend AB
- Nicereply, Inc.
- HappyOrNot Oy
- Feedbackly Oy
Additional Benefits:
- The market estimate (ME) sheet in Excel format
- 3 months of analyst support
TABLE OF CONTENTS
1 INTRODUCTION
- 1.1 Study Assumptions and Market Definition
- 1.2 Scope of the Study
2 RESEARCH METHODOLOGY
3 EXECUTIVE SUMMARY
4 MARKET LANDSCAPE
- 4.1 Market Overview
- 4.2 Market Drivers
- 4.2.1 Continuous Omnichannel Voice-of-Customer Programs
- 4.2.2 AI-Based Analysis of Unstructured Feedback
- 4.2.3 Integration of Feedback with Customer Experience Workflows
- 4.2.4 Rising Adoption of Cloud Software by Small and Medium-Sized Enterprises
- 4.2.5 Expansion of In-App and Digital Journey Feedback
- 4.2.6 Feedback-Linked Personalization and Retention Programs
- 4.3 Market Restraints
- 4.3.1 Data Privacy and Consent Management Complexity
- 4.3.2 Survey Fatigue and Declining Response Quality
- 4.3.3 Integration Barriers Across Legacy Customer Systems
- 4.3.4 Feedback Ownership Fragmentation Across Business Functions
- 4.4 Impact of Macroeconomic Factors on the Market
- 4.5 Industry Value-Chain Analysis
- 4.6 Technology Outlook
- 4.7 Regulatory Landscape
- 4.8 Porter's Five Forces Analysis
- 4.8.1 Threat of New Entrants
- 4.8.2 Bargaining Power of Suppliers
- 4.8.3 Bargaining Power of Buyers
- 4.8.4 Threat of Substitutes
- 4.8.5 Intensity of Competitive Rivalry
5 MARKET SIZE AND GROWTH FORECASTS (VALUE)
- 5.1 By Component
- 5.1.1 Software
- 5.1.1.1 Survey Design and Distribution Tools
- 5.1.1.2 Omnichannel Feedback Collection Solutions
- 5.1.1.3 Voice of Customer (VoC) Management Platforms
- 5.1.1.4 Data Analysis and Reporting Tools
- 5.1.1.5 Feedback Workflow and Case Management Software
- 5.1.2 Services
- 5.1.1 Software
- 5.2 By Feedback Collection Channel
- 5.2.1 Websites and Web Applications
- 5.2.2 Mobile Applications
- 5.2.3 Email
- 5.2.4 Contact Centers
- 5.2.5 Social Media and Review Platforms
- 5.2.6 In-Product Interfaces
- 5.2.7 Physical Locations and Kiosks
- 5.3 By Deployment Mode
- 5.3.1 Cloud
- 5.3.2 On-Premise
- 5.3.3 Hybrid
- 5.4 By Application
- 5.4.1 Voice of Customer (VoC) Management
- 5.4.2 Product Experience Management
- 5.4.3 Brand and Reputation Management
- 5.4.4 Customer Service Quality Management
- 5.4.5 Customer Research and Market Validation
- 5.4.6 Customer Retention and Churn Prevention
- 5.5 By End User
- 5.5.1 IT and Telecommunication
- 5.5.2 BFSI
- 5.5.3 Healthcare and Life Sciences
- 5.5.4 Retail and E-Commerce
- 5.5.5 Industrial Manufacturing
- 5.5.6 Education and Research Institutions
- 5.5.7 Media and Entertainment
- 5.5.8 Government and Administration
- 5.5.9 Travel and Hospitality
- 5.5.10 Other End Users
- 5.6 By Geography
- 5.6.1 North America
- 5.6.1.1 United States
- 5.6.1.2 Canada
- 5.6.1.3 Mexico
- 5.6.2 South America
- 5.6.2.1 Brazil
- 5.6.2.2 Argentina
- 5.6.2.3 Rest of South America
- 5.6.3 Europe
- 5.6.3.1 Germany
- 5.6.3.2 United Kingdom
- 5.6.3.3 France
- 5.6.3.4 Russia
- 5.6.3.5 Spain
- 5.6.3.6 Rest of Europe
- 5.6.4 Asia-Pacific
- 5.6.4.1 China
- 5.6.4.2 Japan
- 5.6.4.3 India
- 5.6.4.4 South Korea
- 5.6.4.5 Southeast Asia
- 5.6.4.6 Rest of Asia-Pacific
- 5.6.5 Middle East and Africa
- 5.6.5.1 Middle East
- 5.6.5.1.1 Saudi Arabia
- 5.6.5.1.2 United Arab Emirates
- 5.6.5.1.3 Rest of Middle East
- 5.6.5.2 Africa
- 5.6.5.2.1 South Africa
- 5.6.5.2.2 Nigeria
- 5.6.5.2.3 Rest of Africa
- 5.6.5.1 Middle East
- 5.6.1 North America
6 COMPETITIVE LANDSCAPE
- 6.1 Market Concentration
- 6.2 Strategic Moves
- 6.3 Market Share Analysis
- 6.4 Company Profiles (includes Global Level Overview, Market Level Overview, Core Segments, Financials as available, Strategic Information, Market Rank/Share, Products and Services, Recent Developments)
- 6.4.1 Qualtrics International Inc.
- 6.4.2 Medallia, Inc.
- 6.4.3 Momentive Inc.
- 6.4.4 Alchemer LLC
- 6.4.5 Zoho Corporation Private Limited
- 6.4.6 Typeform S.L.
- 6.4.7 SurveySparrow Inc.
- 6.4.8 Sogolytics LLC
- 6.4.9 QuestionPro Inc.
- 6.4.10 Survicate Sp. z o.o.
- 6.4.11 AskNicely, Inc.
- 6.4.12 UserVoice, Inc.
- 6.4.13 InMoment, Inc.
- 6.4.14 Mopinion B.V.
- 6.4.15 Zonka Technologies Private Limited
- 6.4.16 SmartSurvey Limited
- 6.4.17 Snap Surveys Limited
- 6.4.18 LimeSurvey GmbH
- 6.4.19 WorldAPP, Inc.
- 6.4.20 SurveyLegend AB
- 6.4.21 Nicereply, Inc.
- 6.4.22 HappyOrNot Oy
- 6.4.23 Feedbackly Oy
7 MARKET OPPORTUNITIES AND FUTURE OUTLOOK
- 7.1 White-Space and Unmet-Need Assessment

