PUBLISHER: Mordor Intelligence | PRODUCT CODE: 2119003

PUBLISHER: Mordor Intelligence | PRODUCT CODE: 2119003
United States Confectionery - Market Share Analysis, Industry Trends & Statistics, Growth Forecasts (2026 - 2031)
According to Mordor Intelligence, the United States confectionery market stood at USD 59.38 billion in 2025 and is valued at USD 62.75 billion in 2026, projected to reach USD 84.44 billion by 2031, expanding at a CAGR of 6.12% over the forecast period.
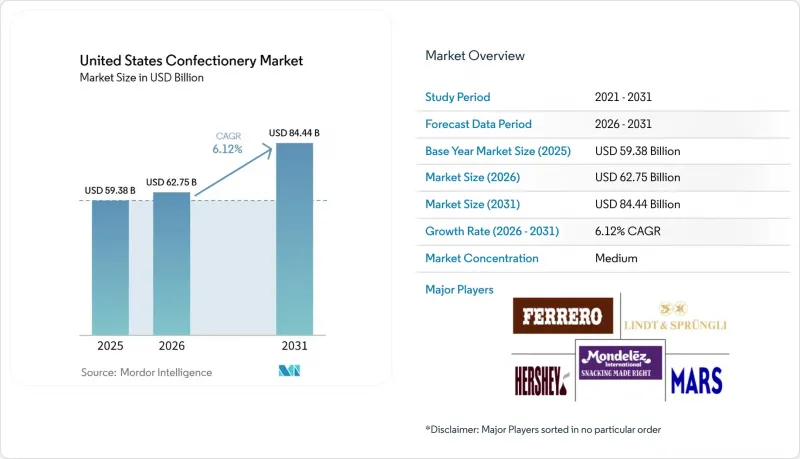
This report is Segmented by Product Type (Chocolates, Gums, and More), Packaging Type (Single-Serve and Multipacks), Price Tier (Mass and Premium), and Distribution Channel (Supermarkets/Hypermarkets, Convenience Stores, and More). The Market Forecasts are Provided in Terms of Value (USD).
United States Confectionery Market Trends and Insights
Innovative Flavors and Formats Driving Product Trials
The willingness of U.S. consumers to experiment with unfamiliar textures and flavour combinations has become one of the most monetisable dynamics in the category. Circana's July 2025 shopper survey noted that flavour and format innovation, alongside omnichannel growth and pack-price flexibility, are among the five core forces sustaining confectionery category relevance. The less obvious implication is that format disruption, particularly the freeze-dried candy phenomenon, is creating micro-categories with standalone growth trajectories that are not captured in legacy segment data. TikTok's #freezedriedcandy hashtag had accumulated 4.7 billion views by early 2025, per confectionery trade publication data, and industry titans are already responding: The Hershey Company launched freeze-dried Jolly Rancher variants specifically to address the unmet demand for unique texture experiences that viral discovery had surfaced. Flavour mashups and co-branded formats are now accelerating new product development cycles, with innovation planning horizons at major manufacturers compressing from 18 to as few as 6 months to keep pace with trend velocity.
Seasonal Gifting and Festive Consumption Boosting Sales
The four major candy seasons, Valentine's Day, Easter, Halloween, and the winter holidays, accounted for the majority of all U.S. confectionery sales in 2025, according to the NCA's 2026 State of Treating report, a figure essentially unchanged from pre-pandemic levels and a sign that seasonal anchoring is structurally durable. The winter holidays alone generated approximately USD 7.5 billion in 2024, the largest single seasonal moment, while Halloween candy spending was projected at USD 3.9 billion in 2025 by the National Retail Federation . The second-order insight is that seasonal programming is now functioning as the primary growth driver for some manufacturers: Mondelez International reported that seasonal confectionery accounted for all the company's U.S. confectionery category growth in 2025. This concentration effect means that supply chain agility, seasonal SKU management, and in-store activation capabilities are increasingly decisive competitive differentiators. The majority of consumers specified they want holiday-specific packaging, shapes, and flavours, which gives major brands with dedicated seasonal innovation pipelines a recurring structural advantage over value-only players.
Rising Health Concerns Over Sugar Consumption
Sugar-related health concerns are exerting structural pressure on confectionery consumption frequency, even as per-occasion spending rises. What makes this restraint strategically complex is that it cuts differently across income bands: higher-income GLP-1 households reduced grocery spending by more, but Lindt simultaneously reported that US premium chocolate sales rose nearly 17% among GLP-1 users in 2025 versus 6.5% among non-users, suggesting that health-conscious consumers are reducing frequency but trading up sharply on the occasions they do indulge. The FDA's January 2025 proposed front-of-package rule, requiring packaged foods to display saturated fat, sodium, and added sugars as Low, Medium, or High on the principal display panel, is a compliance factor that will compel reformulation, particularly in the hard candy, gummy, and standard chocolate segments. The brazzein sweetener, approved by the FDA via a "No Questions" letter issued in April 2025, offers a precision fermentation-derived natural alternative that could enable manufacturers to achieve 20-40% sugar reduction without compromising sensory quality, but commercial-scale deployment at major brands is still several years away.
Other drivers and restraints analyzed in the detailed report include:
- Premium and Artisanal Confectionery Gaining Consumer Interest
- Social Media Marketing Accelerates Product Discovery
- Volatile Cocoa and Sugar Prices Impact Margins
- Rising Health Concerns Over Sugar Consumption
For complete list of drivers and restraints, kindly check the Table Of Contents.
Segment Analysis
Chocolates hold a commanding 47.22% share of the United States confectionery market in 2025, an enduring position built on deep brand equity, seasonal gifting cycles, and near-universal household penetration. Snack bars are the fastest-growing segment at a 6.88% CAGR through 2031, as protein-centric consumption shifts redirect snack occasions away from pure indulgence toward functional satisfaction. The Simply Good Foods Company's Quest brand, which operates within the protein bar sub-category, generated USD 863 million in net sales in fiscal 2025, a 13% increase on a 52-week basis and a compound annual growth rate of approximately 20% since its 2019 acquisition, according to the company's fiscal 2025 annual report filed with the SEC.
Within the snack bar segment, the protein bar sub-segment held the largest share in 2025, followed by cereal bars and fruit & nut bars; energy bars are the smallest sub-segment but benefit from fitness culture tailwinds and increasing distribution through convenience and specialty channels. Gums posted growth, while sugar confectionery, spanning hard candy, lollipops, mints, gummies, pastilles, and toffees, gained ground relative to chocolate for the third consecutive year. Non-chocolate candy's share rose in 2025, a trend driven by Gen Z and Millennials over-indexing for gummy, chewy, and freeze-dried formats versus Boomers' preference for traditional milk and dark chocolate. The BUBS viral launch and HARIBO's Wisconsin production ramp, moving from a 157,656 sq ft facility to a 447,216 sq ft warehouse near its Pleasant Prairie factory in Q2 2024, both reflect a supply-side response to surging US demand for gummy and sugar confectionery.
Single-serve formats held 47.28% of the United States confectionery market in 2025, sustained by impulse purchasing at checkout counters, convenience stores, and vending channels where individual portioning and price-point accessibility are dominant purchase drivers. Multipacks are the fastest-growing packaging format, projected at a 6.57% CAGR through 2031, as household buying behaviour and club store expansion reshape the purchase occasion mix. Hershey identified multipacks as the "next growth frontier," backed by consumer research showing they represent a USD 20 billion-plus opportunity across total snacking, with 94% household penetration and 73.4% household penetration specifically in salty snacks, up 14% over four years, according to Hershey's 2025 NCA Sweets & Snacks Expo presentation. The less visible dynamic is that multipacks are functioning as a trip driver at retail: retailers are expanding shelf space to accommodate format growth, and manufacturers are launching multi-brand variety boxes to capture cross-category household baskets.
The shift toward multipacks also reflects a value-seeking behaviour pattern that emerged through successive years of confectionery price inflation. Circana data indicates that trips to value-forward channels, including hard discounters and club stores, increased in 2025, and multipacks are the default format in these environments. GLP-1 users are simultaneously emerging as a new demand driver for smaller portion multipacks: as GLP-1 adopters shift toward more controlled, bite-sized consumption occasions, pre-portioned multipack formats offer the right quantity per occasion without requiring full-size restraint.
Complete Report Scope:
- By Product Type
- Chocolates
- Dark
- Milk/White
- Gums
- Chewing Gum
- Bubble Gum
- Sugar Confectionery
- Hard Candy
- Lollipops
- Mints
- Pastilles, Gummies, and Jellies
- Toffes and Nougats
- Others
- Snack Bars
- Protein Bar
- Cereal Bar
- Fruit & Nut Bar
- Energy Bar
- Chocolates
- By Packaging Type
- Single-serve
- Multipacks
- By Price Tier
- Mass
- Premium
- By Distribution Channel
- Supermarkets/Hypermarkets
- Convenience Stores
- Online Retail Stores
- Other Distribution Channels
List of Companies Covered in this Report:
- Mars, Incorporated
- The Hershey Company
- Mondelez International, Inc.
- Ferrero International S.A.
- Chocoladefabriken Lindt & Sprungli AG
- HARIBO Holding GmbH & Co. KG
- Perfetti Van Melle Group B.V.
- Lotte Wellfood Co., Ltd.
- Tootsie Roll Industries, Inc.
- Apax Partners LLP (owner of The Bazooka Companies)
- Just Born, Inc.
- Meiji Holdings Co., Ltd.
- August Storck KG
- YIldIz Holding A.S.
- Tony's Chocolonely Holding B.V.
- The Simply Good Foods Company
- Palmer Candy Company
- Albanese Confectionery Group, Inc.
- Impact Confections, Inc.
- Goetze's Candy Company, Inc.
Additional Benefits:
- The market estimate (ME) sheet in Excel format
- 3 months of analyst support
TABLE OF CONTENTS
1 INTRODUCTION
- 1.1 Study Assumptions and Market Definition
- 1.2 Scope of the Study
2 RESEARCH METHODOLOGY
3 EXECUTIVE SUMMARY
4 MARKET LANDSCAPE
- 4.1 Market Overview
- 4.2 Market Drivers
- 4.2.1 Innovative flavours and formats driving product trials
- 4.2.2 Seasonal gifting and festive consumption boosting sales
- 4.2.3 Premium and artisanal confectionery gaining consumer interest
- 4.2.4 Social media marketing accelerates product discovery
- 4.2.5 Growing demand for novelty and limited-edition launches
- 4.2.6 Convenience-driven snacking supports impulse confectionery purchases
- 4.3 Market Restraints
- 4.3.1 Rising health concerns over sugar consumption
- 4.3.2 Volatile cocoa and sugar prices impact margins
- 4.3.3 Stringent food labeling and regulatory requirements
- 4.3.4 Consumer shift toward healthier snack alternatives
- 4.4 Consumer Demand Analysis
- 4.5 Regulatory Outlook
- 4.6 Porter's Five Forces
- 4.6.1 Threat of New Entrants
- 4.6.2 Bargaining Power of Buyers
- 4.6.3 Bargaining Power of Suppliers
- 4.6.4 Threat of Substitutes
- 4.6.5 Competitive Rivalry
5 MARKET SIZE AND GROWTH FORECASTS (VALUE)
- 5.1 By Product Type
- 5.1.1 Chocolates
- 5.1.1.1 Dark
- 5.1.1.2 Milk/White
- 5.1.2 Gums
- 5.1.2.1 Chewing Gum
- 5.1.2.2 Bubble Gum
- 5.1.3 Sugar Confectionery
- 5.1.3.1 Hard Candy
- 5.1.3.2 Lollipops
- 5.1.3.3 Mints
- 5.1.3.4 Pastilles, Gummies, and Jellies
- 5.1.3.5 Toffes and Nougats
- 5.1.3.6 Others
- 5.1.4 Snack Bars
- 5.1.4.1 Protein Bar
- 5.1.4.2 Cereal Bar
- 5.1.4.3 Fruit & Nut Bar
- 5.1.4.4 Energy Bar
- 5.1.1 Chocolates
- 5.2 By Packaging Type
- 5.2.1 Single-serve
- 5.2.2 Multipacks
- 5.3 By Price Tier
- 5.3.1 Mass
- 5.3.2 Premium
- 5.4 By Distribution Channel
- 5.4.1 Supermarkets/Hypermarkets
- 5.4.2 Convenience Stores
- 5.4.3 Online Retail Stores
- 5.4.4 Other Distribution Channels
6 COMPETITIVE LANDSCAPE
- 6.1 Market Concentration
- 6.2 Strategic Moves
- 6.3 Market Share Analysis
- 6.4 Company Profiles (includes Global level Overview, Market level overview, Core Segments, Financials as available, Strategic Information, Market Rank/Share for key companies, Products and Services, and Recent Developments)
- 6.4.1 Mars, Incorporated
- 6.4.2 The Hershey Company
- 6.4.3 Mondelez International, Inc.
- 6.4.4 Ferrero International S.A.
- 6.4.5 Chocoladefabriken Lindt & Sprungli AG
- 6.4.6 HARIBO Holding GmbH & Co. KG
- 6.4.7 Perfetti Van Melle Group B.V.
- 6.4.8 Lotte Wellfood Co., Ltd.
- 6.4.9 Tootsie Roll Industries, Inc.
- 6.4.10 Apax Partners LLP (owner of The Bazooka Companies)
- 6.4.11 Just Born, Inc.
- 6.4.12 Meiji Holdings Co., Ltd.
- 6.4.13 August Storck KG
- 6.4.14 YIldIz Holding A.S.
- 6.4.15 Tony's Chocolonely Holding B.V.
- 6.4.16 The Simply Good Foods Company
- 6.4.17 Palmer Candy Company
- 6.4.18 Albanese Confectionery Group, Inc.
- 6.4.19 Impact Confections, Inc.
- 6.4.20 Goetze's Candy Company, Inc.
7 MARKET OPPORTUNITIES AND FUTURE OUTLOOK

