PUBLISHER: Mordor Intelligence | PRODUCT CODE: 2119620

PUBLISHER: Mordor Intelligence | PRODUCT CODE: 2119620
Satellite Payload - Market Share Analysis, Industry Trends & Statistics, Growth Forecasts (2026 - 2031)
According to Mordor Intelligence, satellite payload market size in 2026 is estimated at USD 12.79 billion, growing from 2025 value of USD 11.00 billion with 2031 projections showing USD 27.23 billion, growing at 16.31% CAGR over 2026-2031.
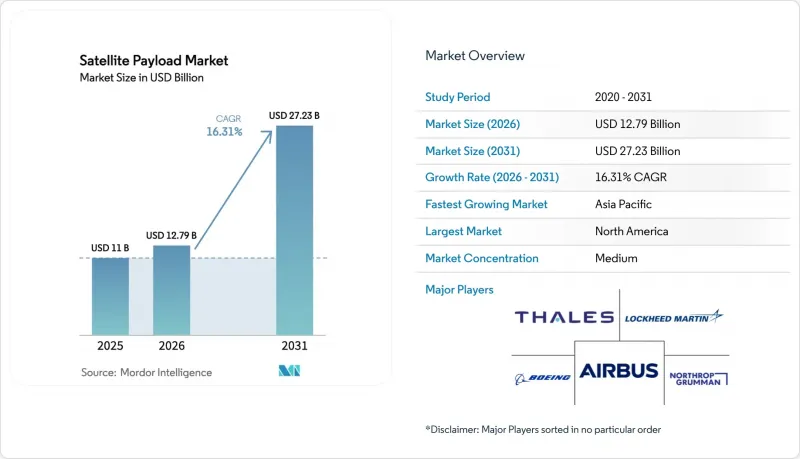
This report is Segmented by Payload Type (Communication, Navigation, Imaging, and More), Orbit (Low Earth Orbit, and More), End-Use (Commercial, Government and Defense, and Dual Use), Application (Communication, Earth Observation/Weather Monitoring, Mapping and Navigation, and More), and Geography (North America, South America, and More). The Market Forecasts are Provided in Terms of Value (USD).
Global Satellite Payload Market Trends and Insights
Rising Government and Multilateral Space-Program Budgets
Defense allocations continue to swell, lifting overall satellite payload demand as governments prioritize resilient, distributed architectures. NASA has earmarked USD 1.3 billion in FY 2025 for commercial LEO development, injecting direct capital into next-generation payload R&D. India's 2024 space budget pushes indigenous payload manufacturing for communications and radar missions. Meanwhile, the US Department of Defense (DoD) taps commercial satellite networks such as Starshield to augment military connectivity, accelerating dual-use uptake. As public agencies spread risk across multiple orbits, suppliers capable of rapid reconfiguration and mass production gain a measurable advantage. The net result is a sustained uplift in contracted payload volumes through mid-decade.
Surging Demand for High-Throughput Broadband Constellations
Starlink's third-generation satellites lift per-spacecraft throughput to roughly one terabit per second, multiplying capacity tenfold versus earlier units. China's GuoWang program counters with a 13,000-satellite roadmap that scales launches at 300 units annually. Downstream, mid-tier manufacturers such as NanoAvionics have secured nine-digit contracts to supply hundreds of platforms, reinforcing a high-volume, low-unit-cost model. Broadband constellations remain the largest demand driver for communication payload assemblies through at least 2028.
Spectrum Congestion and Regulatory Bottlenecks
With LEO and GEO operators fighting over power-flux-density limits, licensing lead times now stretch to nine months in the United States, stalling some constellation deployments. International Telecommunication Union cycles cannot keep pace with innovative waveforms, forcing informal coordination that favors incumbents. The forthcoming EU Space Act is set to impose additional compliance layers on non-European firms, creating parallel regulatory tracks that complicate global rollouts. As spectrum demand surges, payload suppliers must design agile radios and file applications earlier, increasing program risk and cost.
Other drivers and restraints analyzed in the detailed report include:
- Earth-Observation Data Monetization Across Industries
- LEO Constellation Proliferation Lowering Unit Economics
- Stricter Space-Debris Mitigation Standards
For complete list of drivers and restraints, kindly check the Table Of Contents.
Segment Analysis
Communication hardware generated 49.20% of industry revenue in 2025 as broadband and trunking services dominated operator procurement. Software-defined payloads, though still a smaller slice, are advancing at a 21.92% CAGR because their on-orbit reconfiguration cuts lifetime upgrade costs and lets operators shift beams or frequencies to match traffic peaks. Imaging and radar payloads are also on a solid upswing, helped by commercial SAR constellations that sell change-detection data to insurers, energy firms, and governments. Niche scientific instruments-such as quantum-key-distribution terminals and space-weather monitors-round out demand by serving high-margin research missions.
Investor appetite for adaptive architectures means the total satellite payload market value of software-defined platforms could triple between 2026 and 2031 as more LEO and GEO programs switch from analog repeaters to fully digital processors. Miniaturized communication modules now cram multi-gigabit throughput into sub-200 kg buses, encouraging multi-manifest launches and faster replacement cycles. Component vendors follow suit by rolling out radiation-tolerant FPGAs and chipsets that support in-field upgrades, a trend that further cements flexibility as the prime buying criterion. These shifts are tilting procurement scorecards toward payload suppliers that pair reconfigurable hardware with secure, cloud-based mission-planning software.
Low-Earth-orbit (LEO) platforms account for 62.10% of shipped units and are projected to grow at an 18.70% CAGR through 2031, driven by latency-sensitive services that need 30-70 ms round-trip links to smartphones and enterprise terminals. The satellite payload market benefits because standardized LEO buses allow line-production methods similar to automotive plants, significantly compressing build times and unit pricing. Medium-Earth-orbit fleets remain indispensable for navigation networks; Galileo's second-generation craft layer features fully digital payloads and laser cross-links onto electric-propulsion buses to deliver global centimeter-level accuracy.
Geostationary systems face cost pressure yet provide irreplaceable, continent-wide footprints for maritime, aero, and governmental broadcast customers. New small-GEO products such as HummingSat let operators field 2-3 kW payloads at a fraction of legacy launch budgets, widening GEO's addressable market. Forecasts point to just 3-4% annual revenue growth for GEO payloads, but hybrid network designs-where LEO handles high-speed backhaul and GEO provides always-on coverage-should keep demand steady. Procurement templates will likely specify multi-orbit interoperability as a baseline by decade-end, forcing payload designers to prioritize cross-network handshake protocols and agile antennas.
Complete Report Scope:
- By Payload Type
- Communication
- Navigation
- Imaging
- Scientific and Research
- Software-defined Payload
- Radar
- By Orbit
- Low Earth Orbit (LEO)
- Medium Earth Orbit (MEO)
- Geostationary Orbit (GEO)
- By End-Use
- Commercial
- Government and Defense
- Dual Use
- By Application
- Communication
- Earth Observation/Weather Monitoring
- Mapping and Navigation
- Intelligence, Surveillance, and Reconnaissance (ISR)
- Scientific Research and Exploration
- Others (IoT, Asset Tracking, etc.)
- By Geography
- North America
- United States
- Canada
- Mexico
- Europe
- Germany
- United Kingdom
- France
- Russia
- Rest of Europe
- Asia-Pacific
- China
- Japan
- India
- Australia
- Rest of Asia-Pacific
- South America
- Brazil
- Rest of South America
- Middle East and Africa
- Middle East
- United Arab Emirates
- Saudi Arabia
- Rest of Middle East
- Africa
- South Africa
- Rest of Africa
- Middle East
- North America
Geography Analysis
North American operators invested heavily in proliferated LEO architectures during 2024 and 2025, channeling record defense allocations toward communication, ISR, and early-warning missions. Robust private capital supplements public outlays, allowing rapid constellation refresh cycles and stimulating regional demand for software-defined payloads with advanced digital processors. The satellite payload market size attributable to North America is anticipated to reach USD 11.24 billion by 2031, retaining leadership through continuous technology insertion and strong supply-chain depth.
Asia-Pacific's acceleration stems from national champions and a growing venture ecosystem willing to fund broadband, imaging, and lunar-pathfinder projects. China's GuoWang and GalaxySpace programs target direct-to-device services, while India's commercial-friendly reforms open launch pads and clean-room capacity to private firms. Government-backed insurance pools partly offset debris-related risk, hastening new-entrant participation. The region's share of the satellite payload market could climb from 21.18% in 2025 to nearly 27.34% by 2031 if launch cadence holds.
Europe benefits from ESA-funded programs such as the small-GEO initiative and next-generation Galileo satellites incorporating all-digital payload chains. Regulatory leadership on sustainability and orbital-debris mitigation shapes operator behavior, encouraging designs with autonomous collision-avoidance and rapid de-orbit devices. Although manufacturing costs remain structurally higher, the continent differentiates in terms of technical sophistication and sovereign-secure solutions demanded by defense ministries.
- Airbus SE
- Lockheed Martin Corporation
- Thales Group
- RTX Corporation
- Northrop Grumman Corporation
- The Boeing Company
- L3Harris Technologies, Inc.
- Honeywell International Inc.
- Sierra Nevada Company, LLC
- Space Exploration Technologies Corp.
- Maxar Technologies Holdings Inc.
- OHB SE
- Surrey Satellite Technology Limited
- Capella Space Corp.
- MDA Ltd.
- Satixfy UK Limited
- BAE Systems plc
- Rocket Lab USA, Inc.
- Blue Canyon Technologies LLC
- Israel Aerospace Industries Ltd.
Additional Benefits:
- The market estimate (ME) sheet in Excel format
- 3 months of analyst support
TABLE OF CONTENTS
1 INTRODUCTION
- 1.1 Study Assumptions and Market Definition
- 1.2 Scope of the Study
2 RESEARCH METHODOLOGY
3 EXECUTIVE SUMMARY
4 MARKET LANDSCAPE
- 4.1 Market Overview
- 4.2 Market Drivers
- 4.2.1 Rising government and multilateral space-program budgets
- 4.2.2 Surging demand for high-throughput broadband constellations
- 4.2.3 Earth-observation data monetization across industries
- 4.2.4 LEO constellation proliferation lowering unit economics
- 4.2.5 Adoption of software-defined reconfigurable payloads
- 4.2.6 Low-cost rideshare and micro-launchers expanding access
- 4.3 Market Restraints
- 4.3.1 Spectrum congestion and regulatory bottlenecks
- 4.3.2 Escalating R&D cost of next-gen payload technologies
- 4.3.3 Stricter space-debris mitigation standards
- 4.3.4 Uncertainty in on-orbit servicing revenue models
- 4.4 Value Chain Analysis
- 4.5 Regulatory Landscape
- 4.6 Technological Outlook
- 4.7 Porter's Five Forces Analysis
- 4.7.1 Threat of New Entrants
- 4.7.2 Bargaining Power of Buyers
- 4.7.3 Bargaining Power of Suppliers
- 4.7.4 Threat of Substitute Products
- 4.7.5 Intensity of Competitive Rivalry
5 MARKET SIZE AND GROWTH FORECASTS (VALUE)
- 5.1 By Payload Type
- 5.1.1 Communication
- 5.1.2 Navigation
- 5.1.3 Imaging
- 5.1.4 Scientific and Research
- 5.1.5 Software-defined Payload
- 5.1.6 Radar
- 5.2 By Orbit
- 5.2.1 Low Earth Orbit (LEO)
- 5.2.2 Medium Earth Orbit (MEO)
- 5.2.3 Geostationary Orbit (GEO)
- 5.3 By End-Use
- 5.3.1 Commercial
- 5.3.2 Government and Defense
- 5.3.3 Dual Use
- 5.4 By Application
- 5.4.1 Communication
- 5.4.2 Earth Observation/Weather Monitoring
- 5.4.3 Mapping and Navigation
- 5.4.4 Intelligence, Surveillance, and Reconnaissance (ISR)
- 5.4.5 Scientific Research and Exploration
- 5.4.6 Others (IoT, Asset Tracking, etc.)
- 5.5 By Geography
- 5.5.1 North America
- 5.5.1.1 United States
- 5.5.1.2 Canada
- 5.5.1.3 Mexico
- 5.5.2 Europe
- 5.5.2.1 Germany
- 5.5.2.2 United Kingdom
- 5.5.2.3 France
- 5.5.2.4 Russia
- 5.5.2.5 Rest of Europe
- 5.5.3 Asia-Pacific
- 5.5.3.1 China
- 5.5.3.2 Japan
- 5.5.3.3 India
- 5.5.3.4 Australia
- 5.5.3.5 Rest of Asia-Pacific
- 5.5.4 South America
- 5.5.4.1 Brazil
- 5.5.4.2 Rest of South America
- 5.5.5 Middle East and Africa
- 5.5.5.1 Middle East
- 5.5.5.1.1 United Arab Emirates
- 5.5.5.1.2 Saudi Arabia
- 5.5.5.1.3 Rest of Middle East
- 5.5.5.2 Africa
- 5.5.5.2.1 South Africa
- 5.5.5.2.2 Rest of Africa
- 5.5.5.1 Middle East
- 5.5.1 North America
6 COMPETITIVE LANDSCAPE
- 6.1 Market Concentration
- 6.2 Strategic Moves
- 6.3 Market Share Analysis
- 6.4 Company Profiles (includes Global level Overview, Market level overview, Core Segments, Financials as available, Strategic Information, Market Rank/Share for key companies, Products and Services, and Recent Developments)
- 6.4.1 Airbus SE
- 6.4.2 Lockheed Martin Corporation
- 6.4.3 Thales Group
- 6.4.4 RTX Corporation
- 6.4.5 Northrop Grumman Corporation
- 6.4.6 The Boeing Company
- 6.4.7 L3Harris Technologies, Inc.
- 6.4.8 Honeywell International Inc.
- 6.4.9 Sierra Nevada Company, LLC
- 6.4.10 Space Exploration Technologies Corp.
- 6.4.11 Maxar Technologies Holdings Inc.
- 6.4.12 OHB SE
- 6.4.13 Surrey Satellite Technology Limited
- 6.4.14 Capella Space Corp.
- 6.4.15 MDA Ltd.
- 6.4.16 Satixfy UK Limited
- 6.4.17 BAE Systems plc
- 6.4.18 Rocket Lab USA, Inc.
- 6.4.19 Blue Canyon Technologies LLC
- 6.4.20 Israel Aerospace Industries Ltd.
7 MARKET OPPORTUNITIES AND FUTURE OUTLOOK
- 7.1 White-space and Unmet-Need Assessment

