PUBLISHER: Mordor Intelligence | PRODUCT CODE: 2119630

PUBLISHER: Mordor Intelligence | PRODUCT CODE: 2119630
US Personal Protective Equipment (PPE) - Market Share Analysis, Industry Trends & Statistics, Growth Forecasts (2026 - 2031)
According to Mordor Intelligence, the United States personal protective equipment market size was valued at USD 15.6 billion in 2025 and estimated to grow from USD 17.36 billion in 2026 to reach USD 29.61 billion by 2031, at a CAGR of 11.28% during the forecast period (2026-2031).
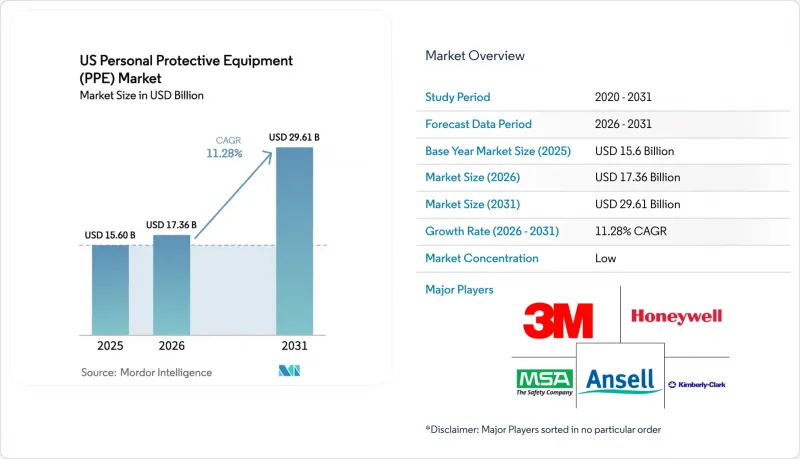
This report is Segmented by Product Type (Hand Protection, Protective Clothing, Respiratory Protection, Protective Footwear, and More), End User (Healthcare and Life Sciences, Construction, Oil and Gas/Petrochemicals, Manufacturing, Food and Beverage, and More), Protection Category (Primary PPE, Secondary PPE, Smart/Connected PPE). The Market Forecasts are Provided in Terms of Value (USD).
US Personal Protective Equipment (PPE) Market Trends and Insights
OSHA-Enforced Safety Violations Driving Replacement Cycles
OSHA cited respiratory protection lapses as the fourth-most frequent violation in 2024, while eye and face protection placed ninth, spotlighting persistent gaps across construction and manufacturing. Proposed civil penalty hikes of up to 3% in 2025 intensify the cost of non-compliance, nudging employers toward proactive bulk purchases rather than ad-hoc orders. Predictive enforcement, built on injury-rate analytics, further broadens inspection reach and accelerates replacement timelines. ANSI and NIOSH certification rules prevent the use of low-grade substitutes, thereby bolstering average selling prices. Together, these factors provide the United States' personal protective equipment market with a consistent regulatory pull-through that buffers cyclical demand swings.
Expansion of U.S. On-Shore Manufacturing Reshoring Initiatives
Roughly 350,000 factory jobs returned to American soil in 2022, and that wave crested higher through 2024 as federal procurement preferences rewarded domestic PPE output. Capital spending followed: 3M earmarked USD 67 million for its Nebraska lines, expressly targeting local PPE contracts. Emerging battery plants in Michigan, Tennessee, and Georgia now require the use of chemical splash garments and high-efficiency respirators to mitigate hazards associated with lithium-ion batteries. The reshoring surge re-anchors demand inside U.S. borders, supporting premium pricing for "Made in USA" labels and shortening delivery windows for large industrial buyers.
Volatile Petro-Chemical Feedstock Prices Inflating Material Costs
Polypropylene and nitrile rubber swings of 25-30% during 2024 compressed disposable glove and mask margins. Cardinal Health identified raw-material volatility as a principal earnings risk in its latest 10-K. DuPont likewise cited volume contraction after raising prices to offset surging input costs, underscoring limited pass-through elasticity. Domestic suppliers must therefore hedge resin exposure or pivot toward reusable lines to protect profitability.
Other drivers and restraints analyzed in the detailed report include:
- Aging Workforce Boosting Demand for Ergonomic PPE
- Surge in Wildfire Smoke Events Spurring Respiratory PPE Sales
- Counterfeit Imports Diluting Branded PPE Share
For complete list of drivers and restraints, kindly check the Table Of Contents.
Segment Analysis
Hand Protection held 29.55% of the United States personal protective equipment market share in 2025, buoyed by universal use across construction, healthcare, and automotive assembly. Disposable nitrile gloves dominate daily consumption patterns, while cut-resistant and chemical-resistant variants serve specialized niches. Frequent replacement cycles and concerns about contamination keep unit velocity high, stabilizing baseline revenue. Respiratory Protection, although smaller, is projected to log a 13.38% CAGR through 2031, the fastest within the category stack. Wildfire smoke mandates, battery-plant hazards, and OSHA crackdowns converge to propel the use of half-mask elastomeric and powered-air systems. Protective Clothing gains incremental lift from reshoring, particularly in battery and semiconductor cleanrooms that insist on splash-proof coveralls.
The United States personal protective equipment market size for Other Product Types, which include smart wearables and exoskeletons, remains comparatively small but exhibits above-market momentum as employers pilot technology-rich solutions. Eye and Face Protection enjoys renewed attention following its placement on OSHA's citation list, with dielectric visors and anti-fog goggles gaining traction. Protective Footwear grows in tandem with federal infrastructure spending that sustains construction employment. Across sub-segments, ANSI and NIOSH standards anchor quality benchmarks, enabling U.S. producers to command price premiums while deterring low-grade imports.
Complete Report Scope:
- By Product Type
- Hand Protection
- Protective Clothing
- Respiratory Protection
- Protective Footwear
- Eye and Face Protection
- Other Product Types
- By End User
- Healthcare and Life Sciences
- Construction
- Oil and Gas / Petrochemicals
- Manufacturing (Discrete and Process)
- Food and Beverage
- Mining and Metals
- Utilities and Energy (incl. Renewables)
- Public Safety and First Responders
- Other End-User
- By Protection Category
- Primary (Direct-contact) PPE
- Secondary (Contamination Barrier) PPE
- Smart / Connected PPE
List of Companies Covered in this Report:
- 3M Company
- Honeywell International Inc.
- DuPont de Nemours, Inc.
- Kimberly-Clark Corporation
- Ansell Limited
- MSA Safety Incorporated
- Cardinal Health, Inc.
- Medline Industries, LP
- Owens & Minor, Inc.
- Lakeland Industries, Inc.
- Alpha Pro Tech, Ltd.
- Radians, Inc.
- Protective Industrial Products, Inc.
- Magid Glove & Safety Mfg. Co. LLC
- Moldex-Metric, Inc.
- Bullard
- Tingley Rubber Corporation
- Dragerwerk AG & Co. KGaA
- Superior Glove Works Ltd.
- Showa Group
- MCR Safety Inc.
- Pyramex Safety Products LLC
- Klein Tools, Inc.
- Towa Corporation
- Gerson Company
Additional Benefits:
- The market estimate (ME) sheet in Excel format
- 3 months of analyst support
TABLE OF CONTENTS
1 INTRODUCTION
- 1.1 Study Assumptions and Market Definition
- 1.2 Scope of the Study
2 RESEARCH METHODOLOGY
3 EXECUTIVE SUMMARY
4 MARKET LANDSCAPE
- 4.1 Market Overview
- 4.2 Market Drivers
- 4.2.1 OSHA-enforced safety violations driving replacement cycles
- 4.2.2 Expansion of U.S. on-shore manufacturing reshoring initiatives
- 4.2.3 Aging workforce boosting demand for ergonomic PPE
- 4.2.4 Surge in wildfire smoke events spurring respiratory PPE sales
- 4.2.5 AI-enabled fit-testing platforms improving compliance
- 4.2.6 Growth of battery-gigafactories requiring specialty chemical-splash gear
- 4.3 Market Restraints
- 4.3.1 Volatile petro-chemical feedstock prices inflating material costs
- 4.3.2 Counterfeit imports diluting branded PPE share
- 4.3.3 End-user "PPE fatigue" lowering compliance in non-regulated sectors
- 4.3.4 Acute labor shortages limiting domestic production scale-up
- 4.4 Supply-Chain Analysis
- 4.5 Regulatory Landscape
- 4.6 Impact of Macroeconomic Factors on the Market
- 4.7 Impact of COVID-19 and Respiratory Pandemics
- 4.8 Porter's Five Forces Analysis
- 4.8.1 Bargaining Power of Suppliers
- 4.8.2 Bargaining Power of Buyers
- 4.8.3 Threat of New Entrants
- 4.8.4 Threat of Substitutes
- 4.8.5 Intensity of Competitive Rivalry
5 MARKET SIZE AND GROWTH FORECASTS (VALUE)
- 5.1 By Product Type
- 5.1.1 Hand Protection
- 5.1.2 Protective Clothing
- 5.1.3 Respiratory Protection
- 5.1.4 Protective Footwear
- 5.1.5 Eye and Face Protection
- 5.1.6 Other Product Types
- 5.2 By End User
- 5.2.1 Healthcare and Life Sciences
- 5.2.2 Construction
- 5.2.3 Oil and Gas / Petrochemicals
- 5.2.4 Manufacturing (Discrete and Process)
- 5.2.5 Food and Beverage
- 5.2.6 Mining and Metals
- 5.2.7 Utilities and Energy (incl. Renewables)
- 5.2.8 Public Safety and First Responders
- 5.2.9 Other End-User
- 5.3 By Protection Category
- 5.3.1 Primary (Direct-contact) PPE
- 5.3.2 Secondary (Contamination Barrier) PPE
- 5.3.3 Smart / Connected PPE
6 COMPETITIVE LANDSCAPE
- 6.1 Market Concentration
- 6.2 Strategic Moves
- 6.3 Market Share Analysis
- 6.4 Company Profiles (includes Global level Overview, Market level overview, Core Segments, Financials as available, Strategic Information, Market Rank/Share for key companies, Products and Services, and Recent Developments)
- 6.4.1 3M Company
- 6.4.2 Honeywell International Inc.
- 6.4.3 DuPont de Nemours, Inc.
- 6.4.4 Kimberly-Clark Corporation
- 6.4.5 Ansell Limited
- 6.4.6 MSA Safety Incorporated
- 6.4.7 Cardinal Health, Inc.
- 6.4.8 Medline Industries, LP
- 6.4.9 Owens & Minor, Inc.
- 6.4.10 Lakeland Industries, Inc.
- 6.4.11 Alpha Pro Tech, Ltd.
- 6.4.12 Radians, Inc.
- 6.4.13 Protective Industrial Products, Inc.
- 6.4.14 Magid Glove & Safety Mfg. Co. LLC
- 6.4.15 Moldex-Metric, Inc.
- 6.4.16 Bullard
- 6.4.17 Tingley Rubber Corporation
- 6.4.18 Dragerwerk AG & Co. KGaA
- 6.4.19 Superior Glove Works Ltd.
- 6.4.20 Showa Group
- 6.4.21 MCR Safety Inc.
- 6.4.22 Pyramex Safety Products LLC
- 6.4.23 Klein Tools, Inc.
- 6.4.24 Towa Corporation
- 6.4.25 Gerson Company
7 MARKET OPPORTUNITIES AND FUTURE OUTLOOK
- 7.1 White-Space and Unmet-Need Assessment

