PUBLISHER: Mordor Intelligence | PRODUCT CODE: 2119632

PUBLISHER: Mordor Intelligence | PRODUCT CODE: 2119632
Dallas Data Center - Market Share Analysis, Industry Trends & Statistics, Growth Forecasts (2026 - 2031)
According to Mordor Intelligence, the dallas data center market size was valued at 2.01 GW in 2025 and estimated to grow from 2.09 GW in 2026 to reach 2.55 GW by 2031, at a CAGR of 4.06% during the forecast period (2026-2031).
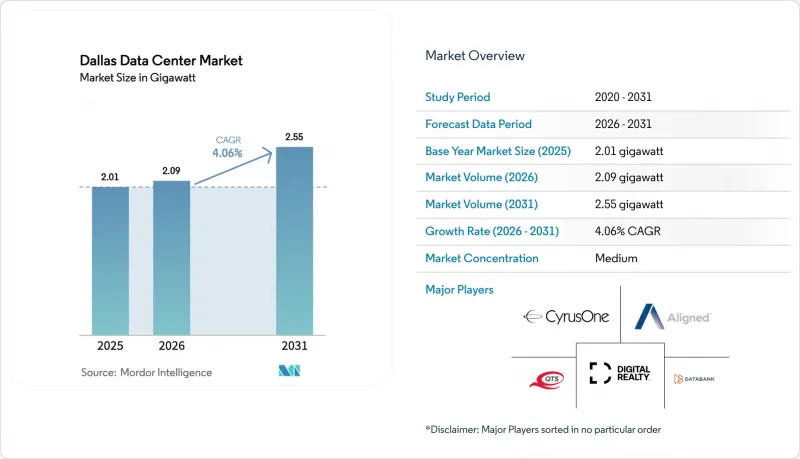
This report is Segmented by Data Center Size (Small, Medium, Large, Massive, Mega), Tier Type (Tier 1&2, Tier 3, Tier 4), Data Center Type(Colocation, Cloud Service Providers (CSPs), Enterprise, Modular, and Edge). The Market Forecasts are Provided in Terms of Value (USD).
Dallas Data Center Market Trends and Insights
Hyperscaler migration from Dallas & Houston corridors
Hyperscale operators now concentrate deployment in the Dallas data center market to reduce latency across national backbones to leverage richer carrier diversity than Houston offers. Google has assembled more than 2 million ft2 across Midlothian Red Oak campuses, while Microsoft is progressing with a four-facility Irving complex. This consolidation accelerated after Winter Storm Uri, prompting operators to favor regions with multi-fuel power portfolios stronger transmission interconnections. Subsequent l-banking around substations outside central Dallas indicates a move toward self-generation onsite energy-storage models that insulate workloads from curtailment events.
Enterprise cloud off-load from semiconductor build-out
Texas Instruments' USD 30 billion Sherman fabrication plant has catalyzed a wave of semiconductor projects in Central Texas, those factories require ultra-low-latency cloud services for process controls. Fabricators now contract for dedicated colocation halls within 50 miles of production lines, anchoring new dem along the I-35 corridor between Dallas. AI-enabled manufacturing further multiplies data volumes, making proximity-based capacity a strategic necessity through 2030. Operators that can pair flexible power with sub-5-millisecond latency corridors st to capture long-duration enterprise contracts.
Power-grid volatility and curtailment risk
Peak ERCOT dem could rise 78% by 2030, much of it from the Dallas data center market, raising reserve-margin requirements forcing operators into expensive dem response or onsite generation. Oncor reports 59 GW of data-center load in interconnection queues, foreshadowing longer lead times for feeder upgrades oncor.com. Hyperscalers answer with dedicated gas turbines, fuel cells, battery arrays that keep AI training clusters online when ERCOT issues conservation notices, but smaller providers face capital hurdles that may slow new-build schedules.
Other drivers and restraints analyzed in the detailed report include:
- Texas sales- property-tax abatements
- Cheap renewable PPAs via ERCOT reforms
- Shrinking water table and cooling-water moratoriums
For complete list of drivers and restraints, kindly check the Table Of Contents.
Segment Analysis
Mega campuses typified by 250-1,000 MW footprints are on pace to lift the Dallas data center market size for large-format builds at a 7.35% CAGR, supported by pledges from Crusoe, DataBank, hyperscale clouds. The segment's rise follows economic logic: GPU clusters achieve superior power-utilization efficiency simpler network topologies when aggregated at gigawatt scale. Mega-site developers routinely secure l tracts exceeding 500 acres near dual 345-kV transmission loops, then layer in substation upgrades months before ground-breaking to compress energization timelines. Extensive renewable PPAs hedge exposure to ERCOT real-time pricing spikes, giving Mega operators an opex edge that attracts high-density AI tenants.
Massive facilities (100-250 MW) remain the Dallas data center market's largest cohort with a 42.90% share in 2025 continue to anchor cloud-on-ramp hubs financial-services clusters. Their multi-tenant halls accommodate workloads that cannot tolerate the latency introduced by edge nodes yet do not justify mega-scale capex. Small medium white-space deployments, meanwhile, supply disaster-recovery geo-redundancy roles but face flat dem as enterprises migrate high-compute tasks into hyperscale core regions. Consolidation pressures will likely accelerate acquisitions of older small facilities by REITs seeking bolt-on capacity near fiber corridors.
Complete Report Scope:
- By Data Center Size
- Small
- Medium
- Large
- Massive
- Mega
- By Tier Type
- Tier 1 and 2
- Tier 3
- Tier 4
- By Data Center Type
- Cloud Service Providers (CSPs)
- Enterprise, Modular and Edge
- Colocation
- Utilized
- Colocation Type
- Retail
- Wholesale
- Hyperscale
- End User
- Cloud and IT
- Telecom
- Media and Entertainment
- Government
- BFSI
- Manufacturing
- E-Commerce
- Other End User
- Colocation Type
- Utilized
List of Companies Covered in this Report:
- Digital Realty Trust Inc.
- CyrusOne LLC
- DataBank Ltd.
- Switch Inc.
- Sabey Data Center Properties LLC
- QTS Realty Trust Inc.
- Equinix Inc.
- Aligned Data Centers
- EdgeConneX Inc.
- NTT Global Data Centers Americas Inc.
- Compass Datacenters LLC
- Stream Data Centers LP
- Flexential Corp.
- TierPoint LLC
- CoreSite Realty Corp.
- Iron Mountain Data Centers
- Google LLC (Self-build)
- Amazon Web Services Inc. (Self-build)
- Microsoft Corp. (Self-build)
- Meta Platforms Inc. (Self-build)
Additional Benefits:
- The market estimate (ME) sheet in Excel format
- 3 months of analyst support
TABLE OF CONTENTS
1 INTRODUCTION
- 1.1 Study Assumptions & Market Definition
- 1.2 Scope of the Study
2 RESEARCH METHODOLOGY
3 EXECUTIVE SUMMARY
4 MARKET LANDSCAPE
- 4.1 Market Overview
- 4.2 Market Drivers
- 4.2.1 Hyperscaler migration from Dallas & Houston corridors
- 4.2.2 Enterprise cloud off-load from "Silicon Hills" semiconductor expansion
- 4.2.3 Texas sales- and property-tax abatements for mission-critical facilities
- 4.2.4 Cheap renewable PPAs via ERCOT's congestion-zone reforms
- 4.2.5 Increasing edge-compute demand from autonomous-vehicle testing cluster
- 4.2.6 Rapid 5G densification raising micro-edge colocation needs
- 4.3 Market Restraints
- 4.3.1 Power-grid volatility & curtailment risk
- 4.3.2 Shrinking water table & cooling-water moratoriums
- 4.3.3 Escalating Williamson- & Travis-County land valuations
- 4.3.4 Specialized workforce shortage in critical-facility O&M
- 4.4 Value / Supply-Chain Analysis
- 4.5 Regulatory Landscape
- 4.6 Technological Outlook
- 4.7 Investment & Capacity Pipeline Analysis
- 4.8 Porter's Five Forces Analysis
- 4.8.1 Threat of New Entrants
- 4.8.2 Bargaining Power of Suppliers
- 4.8.3 Bargaining Power of Buyers
- 4.8.4 Threat of Substitutes
- 4.8.5 Competitive Rivalry
- 4.9 Assessment of Macro Economic Trends on the Market
5 MARKET SIZE AND GROWTH FORECASTS (MW)
- 5.1 By Data Center Size
- 5.1.1 Small
- 5.1.2 Medium
- 5.1.3 Large
- 5.1.4 Massive
- 5.1.5 Mega
- 5.2 By Tier Type
- 5.2.1 Tier 1 and 2
- 5.2.2 Tier 3
- 5.2.3 Tier 4
- 5.3 By Data Center Type
- 5.3.1 Cloud Service Providers (CSPs)
- 5.3.2 Enterprise, Modular and Edge
- 5.3.3 Colocation
- 5.3.3.1 Utilized
- 5.3.3.1.1 Colocation Type
- 5.3.3.1.1.1 Retail
- 5.3.3.1.1.2 Wholesale
- 5.3.3.1.1.3 Hyperscale
- 5.3.3.1.2 End User
- 5.3.3.1.2.1 Cloud and IT
- 5.3.3.1.2.2 Telecom
- 5.3.3.1.2.3 Media and Entertainment
- 5.3.3.1.2.4 Government
- 5.3.3.1.2.5 BFSI
- 5.3.3.1.2.6 Manufacturing
- 5.3.3.1.2.7 E-Commerce
- 5.3.3.1.2.8 Other End User
- 5.3.3.1.1 Colocation Type
- 5.3.3.1 Utilized
6 COMPETITIVE LANDSCAPE
- 6.1 Market Concentration
- 6.2 Strategic Moves
- 6.3 Market Share Analysis
- 6.4 Company Profiles (includes Global level Overview, Market level Overview, Core Segments, Financials as available, Strategic Information, Market Rank/Share, Products & Services, Recent Developments)
- 6.4.1 Digital Realty Trust Inc.
- 6.4.2 CyrusOne LLC
- 6.4.3 DataBank Ltd.
- 6.4.4 Switch Inc.
- 6.4.5 Sabey Data Center Properties LLC
- 6.4.6 QTS Realty Trust Inc.
- 6.4.7 Equinix Inc.
- 6.4.8 Aligned Data Centers
- 6.4.9 EdgeConneX Inc.
- 6.4.10 NTT Global Data Centers Americas Inc.
- 6.4.11 Compass Datacenters LLC
- 6.4.12 Stream Data Centers LP
- 6.4.13 Flexential Corp.
- 6.4.14 TierPoint LLC
- 6.4.15 CoreSite Realty Corp.
- 6.4.16 Iron Mountain Data Centers
- 6.4.17 Google LLC (Self-build)
- 6.4.18 Amazon Web Services Inc. (Self-build)
- 6.4.19 Microsoft Corp. (Self-build)
- 6.4.20 Meta Platforms Inc. (Self-build)
7 MARKET OPPORTUNITIES AND FUTURE OUTLOOK
- 7.1 White-space & Unmet-need Assessment

