PUBLISHER: Mordor Intelligence | PRODUCT CODE: 2119712

PUBLISHER: Mordor Intelligence | PRODUCT CODE: 2119712
Next-generation Computing - Market Share Analysis, Industry Trends & Statistics, Growth Forecasts (2026 - 2031)
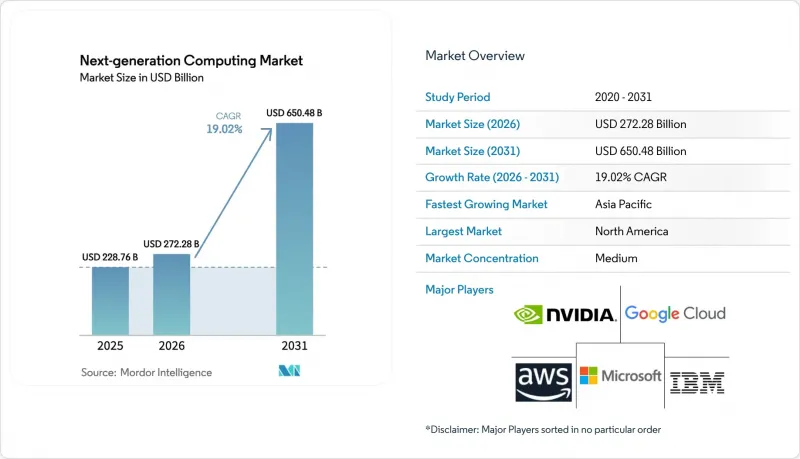
According to Mordor Intelligence, the next-generation computing market size is expected to grow from USD 228.76 billion in 2025 to USD 272.28 billion in 2026 and is forecast to reach USD 650.48 billion by 2031 at 19.02% CAGR over 2026-2031.
This report is Segmented by Component (Hardware, Software, Services), Computing Paradigm (High-Performance Computing (HPC), Quantum Computing, Optical/Photonic Computing, Neuromorphic Computing, Edge/Near-Edge Computing, and More), Deployment Mode (Cloud, On-Premise, Hybrid), End-User Industry (BFSI, Healthcare and Life Sciences, Automotive and Transportation, Energy and Utilities, and More), and Geography.
Global Next-generation Computing Market Trends and Insights
Demand surge for generative-AI compute scaling
Fiscal-2025 datacenter revenue at a leading GPU vendor more than doubled year-over-year, confirming that large language models (LLMs) and image generators now dominate silicon demand. Blackwell-class processors integrated 208 billion transistors, enabling trillion-parameter inference with a fraction of prior-generation energy draw. Cloud providers responded by releasing dedicated AI instances that bundle low-latency networking and pooled high-bandwidth memory, allowing medium-sized firms to access exa-scale capacity on demand. System integrators simultaneously re-engineered board-level power delivery and introduced software stacks that finesse scheduling across thousands of GPUs, flattening barriers to entry. These steps combined to accelerate capital flows into the next-generation computing market and to reinforce hardware refresh cycles.
Government funding waves for quantum-tech hubs
The United States Department of Energy opened USD 625 million in fresh awards for quantum research in January 2025. Similar UK allocations of GBP 121 million (USD 164.34 million) supported national testbeds and business accelerators. Funding clusters anchor universities, national labs, and private suppliers into long-term partnerships, share prototyping risk, and catalyse workforce development through fellowship programmes. In parallel, Japan and India enlarged their sovereign quantum budgets to build supply-chain resilience around dilution refrigerators, photonics, and control electronics. These initiatives triggered patent filings in qubit connectivity, cryogenic packaging, and error-mitigation algorithms, adding durable momentum to the next-generation computing market.
Quantum-skilled talent shortage
A 2025 survey of quantum-technology stakeholders showed 45% citing workforce scarcity as their primary adoption barrier. Quantum algorithm design blends physics, mathematics, and computer science, yet mainstream curricula rarely cover all three. Enterprises attempted to close gaps via internal boot camps and joint university chairs, but ramp-up time often exceeded project deadlines. While government scholarships expanded PhD enrolment, near-term supply remained tight, delaying planned roll-outs in cryptography, optimisation, and material-science workloads and moderating overall expansion of the next-generation computing market.
Other drivers and restraints analyzed in the detailed report include:
- Edge-to-cloud convergence for ultra-low-latency IoT
- Falling GPU TCO via cloud credits and open-IP chiplets
- Grid-power and permitting bottlenecks for hyperscale DCs
For complete list of drivers and restraints, kindly check the Table Of Contents.
Segment Analysis
The next-generation computing market size tied to hardware reached USD 106.59 billion in 2025, powered by the adoption of GPUs, tensor processing units, and photonic interconnects. Exascale-class boards integrated six HBM stacks, doubling bandwidth and allowing 10X larger model training batches. Memory producers committed capacity expansions to meet a projected fifteen-fold increase in HBM demand for HPC and AI by 2035, safeguarding component supply. Power-efficient optical links also entered mainstream server boards, cutting latency between accelerator pods to microsecond levels.
Services, although smaller, grew faster by handling architecture design, secure deployment, and life-cycle management. Managed quantum workloads, AI-pipeline optimisation, and proactive cooling analytics formed new fee lines. Cloud providers bundled professional services hours into platform subscriptions, creating annuity-style revenue. This hybrid revenue mix improved resilience in the next-generation computing market during hardware supply oscillations and cultivated customer lock-in around specialised toolchains.
HPC still delivered the bulk of 2024 revenue, thanks to well-established procurement cycles in weather modelling, fluid dynamics, and financial risk grids. Vendors launched exascale systems that combined x86 or Arm CPUs with next-generation GPUs on NVLink-over-Ethernet fabrics, offering single-precision throughput beyond seven exaflops. Such leaps sustained the next-generation computing market even as alternative paradigms matured.
Quantum computing exhibited the steepest growth curve. D-Wave released a 5,000-plus-qubit annealer geared for combinatorial optimisation, while trapped-ion and neutral-atom providers attracted venture funding for error-corrected prototypes. Early hybrid pilots saw quantum kernels accelerate Monte Carlo simulation convergence in high-finance risk models. Given its 34.05% CAGR outlook, quantum will progressively erode classical-only budgets, solidifying its role in the overall next-generation computing market.
Complete Report Scope:
- By Component
- Hardware
- Processors and Accelerators
- Memory and Storage
- Interconnect and Networking
- Thermal and Power Solutions
- Software
- Services
- Hardware
- By Computing Paradigm
- High-Performance Computing (HPC)
- Quantum Computing
- Optical/Photonic Computing
- Neuromorphic Computing
- Edge / Near-Edge Computing
- Cloud-Native Accelerated Computing
- Hybrid and Other Emerging
- By Deployment Mode
- Cloud
- On-Premise
- Hybrid
- By End-user Industry
- BFSI
- Healthcare and Life Sciences
- Automotive and Transportation
- Energy and Utilities
- Aerospace and Defense
- Media and Entertainment
- IT and Telecom
- Retail and e-Commerce
- Manufacturing and Industrial
- Government and Public Sector
- Other End-user Industries
- By Geography
- North America
- United States
- Canada
- Mexico
- South America
- Brazil
- Argentina
- Rest of South America
- Europe
- Germany
- United Kingdom
- France
- Italy
- Russia
- Rest of Europe
- Asia Pacific
- China
- Japan
- South Korea
- India
- ASEAN
- Rest of Asia Pacific
- Middle East and Africa
- Middle East
- Saudi Arabia
- UAE
- Turkey
- Rest of Middle East
- Africa
- South Africa
- Nigeria
- Rest of Africa
- Middle East
- North America
Geography Analysis
North America generated 40.80% of 2025 revenue in the next-generation computing market. The United States alone accounted for roughly three-quarters of regional spend, buoyed by public financing, deep venture capital, and dominant cloud incumbents. National laboratories operated pathfinder quantum testbeds that integrate neutral-atom arrays with exascale supercomputers, cementing leadership. Energy-efficient data-centre innovations emerged from cross-industry consortia, reflecting policy focus on sustainability.
Asia-Pacific will post the fastest 22.45% CAGR. China, Japan, and India expanded semiconductor park incentives and subsidised quantum-research fellowships. Hyperscale operators pledged to double colocation white-space in Singapore, Sydney, and Mumbai to meet AI demand. Parallel 5G-Advanced roll-outs created new edge-computing nodes, deepening workload localisation and strengthening regional relevance of the next-generation computing market. Australia and South Korea joined multilateral alliances on quantum standards, adding technical pluralism to the region.
Europe preserved a unified industrial strategy combining digital sovereignty and environmental stewardship. Germany's Fraunhofer institutes advanced neuromorphic prototypes targeting sub-watt inference, while French labs piloted photonic-based quantum routers. The EU's fit-for-55 climate package spurred data-centre operators to sign long-term renewable-energy purchase agreements, aligning regulatory compliance with investor pressure. These initiatives elevated Europe's role as a sustainability vanguard within the next-generation computing market.
- Alibaba Group Holding Ltd.
- Amazon Web Services Inc.
- Alphabet Inc. (Google Cloud)
- Microsoft Corp.
- IBM Corp.
- NVIDIA Corp.
- Intel Corp.
- Advanced Micro Devices Inc.
- Cisco Systems Inc.
- Oracle Corp.
- NEC Corp.
- Hewlett Packard Enterprise
- Dell Technologies
- Fujitsu Ltd.
- Graphcore Ltd.
- D-Wave Quantum Inc.
- IonQ Inc.
- Rigetti Computing Inc.
- ARM Ltd.
- PsiQuantum Corp.
- Cerebras Systems Inc.
- Tencent Holdings (Tencent Cloud)
- Baidu Inc.
- Huawei Technologies Co. Ltd.
- Samsung Electronics Co. Ltd.
- Graphcore Ltd.
- Cerebras Systems Inc.
Additional Benefits:
- The market estimate (ME) sheet in Excel format
- 3 months of analyst support
TABLE OF CONTENTS
1 INTRODUCTION
- 1.1 Study Assumptions and Market Definition
- 1.2 Scope of the Study
2 RESEARCH METHODOLOGY
3 EXECUTIVE SUMMARY
4 MARKET LANDSCAPE
- 4.1 Market Overview
- 4.2 Market Drivers
- 4.2.1 Demand surge for generative-AI compute scaling
- 4.2.2 Government funding waves for quantum-tech hubs
- 4.2.3 Edge-to-cloud convergence for ultra-low-latency IoT
- 4.2.4 Falling GPU TCO via cloud credits and open-IP chiplets
- 4.2.5 Liquid-cooling breakthroughs enabling dense HPC racks
- 4.2.6 Secondary market for de-commissioned AI accelerators
- 4.3 Market Restraints
- 4.3.1 Quantum-skilled talent shortage
- 4.3.2 High CAPEX and integration risk for heterogeneous clusters
- 4.3.3 Grid-power and permitting bottlenecks for hyperscale DCs
- 4.3.4 Export-control limits on advanced HBM and GPU shipments
- 4.4 Value Chain Analysis
- 4.5 Regulatory Landscape
- 4.6 Technological Outlook
- 4.7 Porter's Five Forces
- 4.7.1 Bargaining Power of Suppliers
- 4.7.2 Bargaining Power of Buyers
- 4.7.3 Threat of New Entrants
- 4.7.4 Threat of Substitutes
- 4.7.5 Intensity of Competitive Rivalry
- 4.8 Impact of Macroeconomic Factors
- 4.9 Investment Analysis
5 MARKET SIZE AND GROWTH FORECASTS (VALUE)
- 5.1 By Component
- 5.1.1 Hardware
- 5.1.1.1 Processors and Accelerators
- 5.1.1.2 Memory and Storage
- 5.1.1.3 Interconnect and Networking
- 5.1.1.4 Thermal and Power Solutions
- 5.1.2 Software
- 5.1.3 Services
- 5.1.1 Hardware
- 5.2 By Computing Paradigm
- 5.2.1 High-Performance Computing (HPC)
- 5.2.2 Quantum Computing
- 5.2.3 Optical/Photonic Computing
- 5.2.4 Neuromorphic Computing
- 5.2.5 Edge / Near-Edge Computing
- 5.2.6 Cloud-Native Accelerated Computing
- 5.2.7 Hybrid and Other Emerging
- 5.3 By Deployment Mode
- 5.3.1 Cloud
- 5.3.2 On-Premise
- 5.3.3 Hybrid
- 5.4 By End-user Industry
- 5.4.1 BFSI
- 5.4.2 Healthcare and Life Sciences
- 5.4.3 Automotive and Transportation
- 5.4.4 Energy and Utilities
- 5.4.5 Aerospace and Defense
- 5.4.6 Media and Entertainment
- 5.4.7 IT and Telecom
- 5.4.8 Retail and e-Commerce
- 5.4.9 Manufacturing and Industrial
- 5.4.10 Government and Public Sector
- 5.4.11 Other End-user Industries
- 5.5 By Geography
- 5.5.1 North America
- 5.5.1.1 United States
- 5.5.1.2 Canada
- 5.5.1.3 Mexico
- 5.5.2 South America
- 5.5.2.1 Brazil
- 5.5.2.2 Argentina
- 5.5.2.3 Rest of South America
- 5.5.3 Europe
- 5.5.3.1 Germany
- 5.5.3.2 United Kingdom
- 5.5.3.3 France
- 5.5.3.4 Italy
- 5.5.3.5 Russia
- 5.5.3.6 Rest of Europe
- 5.5.4 Asia Pacific
- 5.5.4.1 China
- 5.5.4.2 Japan
- 5.5.4.3 South Korea
- 5.5.4.4 India
- 5.5.4.5 ASEAN
- 5.5.4.6 Rest of Asia Pacific
- 5.5.5 Middle East and Africa
- 5.5.5.1 Middle East
- 5.5.5.1.1 Saudi Arabia
- 5.5.5.1.2 UAE
- 5.5.5.1.3 Turkey
- 5.5.5.1.4 Rest of Middle East
- 5.5.5.2 Africa
- 5.5.5.2.1 South Africa
- 5.5.5.2.2 Nigeria
- 5.5.5.2.3 Rest of Africa
- 5.5.5.1 Middle East
- 5.5.1 North America
6 COMPETITIVE LANDSCAPE
- 6.1 Market Concentration
- 6.2 Strategic Moves
- 6.3 Market Share Analysis
- 6.4 Company Profiles (includes Global-level Overview, Market-level Overview, Core Segments, Financials, Strategic Information, Market Rank/Share, Products and Services, Recent Developments)
- 6.4.1 Alibaba Group Holding Ltd.
- 6.4.2 Amazon Web Services Inc.
- 6.4.3 Alphabet Inc. (Google Cloud)
- 6.4.4 Microsoft Corp.
- 6.4.5 IBM Corp.
- 6.4.6 NVIDIA Corp.
- 6.4.7 Intel Corp.
- 6.4.8 Advanced Micro Devices Inc.
- 6.4.9 Cisco Systems Inc.
- 6.4.10 Oracle Corp.
- 6.4.11 NEC Corp.
- 6.4.12 Hewlett Packard Enterprise
- 6.4.13 Dell Technologies
- 6.4.14 Fujitsu Ltd.
- 6.4.15 Graphcore Ltd.
- 6.4.16 D-Wave Quantum Inc.
- 6.4.17 IonQ Inc.
- 6.4.18 Rigetti Computing Inc.
- 6.4.19 ARM Ltd.
- 6.4.20 PsiQuantum Corp.
- 6.4.21 Cerebras Systems Inc.
- 6.4.22 Tencent Holdings (Tencent Cloud)
- 6.4.23 Baidu Inc.
- 6.4.24 Huawei Technologies Co. Ltd.
- 6.4.25 Samsung Electronics Co. Ltd.
- 6.4.26 Graphcore Ltd.
- 6.4.27 Cerebras Systems Inc.
7 MARKET OPPORTUNITIES AND FUTURE OUTLOOK
- 7.1 White-space and Unmet-need Assessment

