PUBLISHER: Mordor Intelligence | PRODUCT CODE: 2119755

PUBLISHER: Mordor Intelligence | PRODUCT CODE: 2119755
5k Display Resolution - Market Share Analysis, Industry Trends & Statistics, Growth Forecasts (2026 - 2031)
According to Mordor Intelligence, the 5k display resolution market size in 2026 is estimated at USD 0.71 trillion, growing from 2025 value of USD 0.590 trillion with 2031 projections showing USD 1.77 trillion, growing at 20.12% CAGR over 2026-2031.
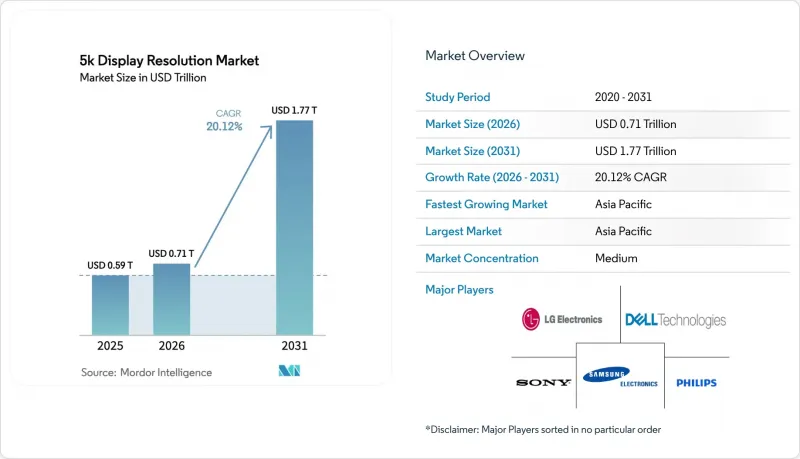
This report is Segmented by Product Type (Monitors, Televisions, and More), Panel Technology (LCD, OLED, Mini-LED/Micro-LED), Native Resolution (5120 X 2880 (16:9), and More), End-User Application (Professional Content Creation, Commercial Digital Signage and Control Rooms, and More), Distribution Channel (Online, Offline), and Geography. The Market Forecasts are Provided in Terms of Value (USD).
Global 5k Display Resolution Market Trends and Insights
Surging Adoption of 5K-Ready Workstations for AI-Assisted Post-Production in Hollywood and Korean Studios
Cutting-edge generative fill, rig removal and HDR tone-mapping tools now operate in real time only when panels present a contiguous 14.7 million-pixel canvas. Early field data from two Los Angeles suites shows a 17% reduction in conform time after replacing dual 4K monitors with single 5K units. Korean drama editors record similar wins and are ordering 43,000 incremental 31-inch IPS 5K screens through 2026. Workstation OEMs quote DisplayPort 2.1 cards as standard, signaling the final removal of bandwidth bottlenecks, and cloud bureau finishing houses echo the shift to 5K because mezzanine ProRes at that resolution stays below 800 Mbps over 10 GbE links.
Expansion of Ultra-Wide 5K Signage in Airport Command-and-Control Upgrades across GCC
Abu Dhabi's Midfield terminal switched on 88 linear meters of 5,120 X 1,440 LED cabinets in November 2024, eliminating bezel artefacts that previously obstructed A-SMGCS overlays. Saudi Arabia's Vision 2030 avionics roadmap earmarks a further 230 such panels for Riyadh and Jeddah by 2026. Ultra-wide canvases match radar sector aspect ratios, decrypting color-critical warnings without forcing operators to scan vertically. Integrators also report a 15% reduction in GPU rack count as single DisplayPort 2.1 feeds can now drive two 5K canvases, lowering power budgets.
High BOM Cost of Mini-LED Backlights in 5K Panels Limiting Mainstream Monitor ASPs
A 32-inch 5K screen needs 2,048 dimming zones versus 1,152 zones on 4K, holding backlight costs at USD 120 above comparable 4K until secondary lens efficiency hits 92%. ODM quotes suggest the delta may not fall below USD 65 until 2026, delaying prosumer price points below USD 799. Value-oriented buyers consequently stick with wide-gamut 4K, tempering near-term unit growth.
Other drivers and restraints analyzed in the detailed report include:
- Proliferation of 5K Surgical Monitors for Robotic-Assisted Procedures in Japan and Germany
- In-Vehicle 5K Instrument Clusters in Premium EVs (Lucid, NIO) Accelerating Automotive Vertical
- Low Penetration of 5K Content Delivery Networks Outside Tier-1 Cities
For complete list of drivers and restraints, kindly check the Table Of Contents.
Segment Analysis
The monitor segment generated 41.27% of 2025 revenue, translating to USD 243.5 billion of the 5k display resolution market. Shipments concentrate in 31.5-inch 5,120 X 2,880 IPS panels bundled with HDR-600 certification. Panel makers leverage matured oxide yields, pushing gross margins to 19% on monitor-class glass. Retail ASPs declined 11% in 2024, broadening appeal among freelance editors and colorists. By contrast, the laptop cohort lags in native 5K penetration, but 14-inch 5,120 X 3,200 OLED panels announced for Q3 2025 shipping insert 5K into mobile creator workflows at under 2 kilograms carry weight.
Laptop and tablet demand will pace at 26.4% CAGR through 2031, the highest across product types. OLED's inherent emissive contrast masks the absence of local dimming on thin-and-light form factors, satisfying HDR specifications without bulkier backlight arrays. Bundled DisplayPort 2.1 alternate-mode USB-C ports guarantee single-cable connections to external 5K reference monitors. This synergy ensures laptops act as both source and companion display, doubling the counted 5K pixel footprint per purchase.
LCD in-plane switching (IPS) and vertical alignment (VA) commanded 62.88% revenue share in 2025. Mature substrate sizes, well-understood polarizer stacks and volume economies keep LCD the anchor segment of the 5k display resolution market. Cost efficiencies will help LCD retain a majority unit share through 2028 even as OLED and mini-LED raise blended ASPs.
Mini-LED / micro-LED, while only 9.48% of 2025 units, accounts for an outsized revenue mix due to ASP premiums that exceed LCD by 2.1X. Segment forecasts point to a 28.9% CAGR, aided by converging costs on large-area mini-LED backlights. Apple, BOE and LG collectively added 35,000 mini-LED bonding heads in 2024, providing the throughput to double output by 2026. The 5k display resolution industry thus leans on hybrid LCD-mini-LED designs for immediate performance gains while true emissive micro-LED matures for volume.
Complete Report Scope:
- By Product Type
- Monitors
- Televisions
- Cameras and Digital Cinema
- Laptops and Tablets
- Smartphones
- Projectors and Others
- By Panel Technology
- LCD (IPS, VA)
- OLED
- Mini-LED / Micro-LED
- By Native Resolution
- 5120 X 2880 (16:9)
- 5120 X 3200 (16:10)
- 5120 X 1440 (21:9)
- By End-user Application
- Professional Content Creation
- Commercial Digital Signage and Control Rooms
- Consumer Gaming and Entertainment
- Education and Training
- Healthcare Imaging
- Automotive Cockpit Displays
- By Distribution Channel
- Online (Direct, Marketplaces)
- Offline (Retail, Pro-AV System Integrators)
- By Geography
- North America
- United States
- Canada
- Mexico
- South America
- Brazil
- Argentina
- Rest of South America
- Europe
- Germany
- United Kingdom
- France
- Italy
- Spain
- Rest of Europe
- Asia-Pacific
- China
- Japan
- South Korea
- India
- Australia
- New Zealand
- Rest of Asia-Pacific
- Middle East and Africa
- United Arab Emirates
- Saudi Arabia
- South Africa
- Rest of Middle East and Africa
- North America
Geography Analysis
Asia-Pacific generated 35.98% of 2025 spending, equal to USD 212.3 billion and 6.4 million units. Creator laptop launches in China and panel self-sufficiency initiatives in Beijing and Hefei concentrate supply chains in the region. Korea's content export boom amplifies workstation upgrades, further cementing Asia-Pacific's role as both supply hub and demand driver.
North America ranked second at 28.05% of 2025 revenue, led by Hollywood studios, AAA game developers and medical device OEMs. The 5k display resolution market size for North America monitors alone is projected to climb from USD 118.4 billion in 2025 to USD 355.9 billion by 2031 at a 20.1% CAGR. Federal investment allowances covering accelerated depreciation on medical capital equipment speed hospital adoption of 5K surgical monitors.
Europe contributed 21.72% of 2025 outlays, underpinned by Germany's precision manufacturing culture and the United Kingdom's broadcast technology sector. Automotive cockpit wins at BMW and Mercedes-Benz place long-dated contracts on local Tier-1 suppliers. EU energy regulations incentivize oxide TFT backplanes that reduce standby power, prompting widescale replacement of legacy 4K control-room arrays with 5K equivalents by 2028.
- Apple Inc.
- Dell Technologies
- HP Inc.
- LG Electronics Inc.
- Samsung Electronics Co. Ltd.
- Sony Group Corp.
- Koninklijke Philips N.V.
- ASUSTeK Computer Inc.
- Micro-Star International Co. Ltd.
- Red Digital Cinema LLC
- Canon Inc.
- Sharp Corp.
- ViewSonic Corp.
- BOE Technology Group Co. Ltd.
- AU Optronics Corp.
- TCL CSOT
- BenQ Corp.
- EIZO Corp.
- Panasonic Holdings Corp.
- Vizio Holding Corp.
Additional Benefits:
- The market estimate (ME) sheet in Excel format
- 3 months of analyst support
TABLE OF CONTENTS
1 INTRODUCTION
- 1.1 Study Assumptions and Market Definition
- 1.2 Scope of the Study
2 RESEARCH METHODOLOGY
3 EXECUTIVE SUMMARY
4 MARKET LANDSCAPE
- 4.1 Market Overview
- 4.2 Market Drivers
- 4.2.1 Surging Adoption of 5K-ready Workstations for AI-assisted Post-Production in Hollywood and Korean Studios
- 4.2.2 Expansion of Ultra-Wide 5K Signage in Airport Command-and-Control Upgrades across GCC
- 4.2.3 Proliferation of 5K Surgical Monitors for Robotic-Assisted Procedures in Japan and Germany
- 4.2.4 Roll-out of DisplayPort 2.1 and Thunderbolt 5 Boosting 5K Docks in Enterprise Desktops
- 4.2.5 Brand-led "Creator Class" Laptop Launches in China Driving Native-5K OLED Panel Demand
- 4.2.6 In-vehicle 5K Instrument Clusters in Premium EVs (Lucid, NIO) Accelerating Automotive Vertical
- 4.3 Market Restraints
- 4.3.1 High BOM Cost of Mini-LED Backlights in 5K Panels Limiting Mainstream Monitor ASPs
- 4.3.2 Low Penetration of 5K Content Delivery Networks Outside Tier-1 Cities
- 4.3.3 Color-Calibration Complexity vs 4K Raising Service Costs for Pro-AV Integrators
- 4.3.4 Substitution Threat from 6K/8K in High-End Cinematography Equipment Procurement Cycles
- 4.4 Technological Outlook
- 4.5 Porter's Five Forces Analysis
- 4.5.1 Bargaining Power of Buyers
- 4.5.2 Bargaining Power of Suppliers
- 4.5.3 Threat of New Entrants
- 4.5.4 Threat of Substitutes
- 4.5.5 Intensity of Competitive Rivalry
- 4.6 Investment Analysis (Capex Trends and VC Funding in 5K Display Fabs)
5 MARKET SIZE AND GROWTH FORECASTS (VALUE)
- 5.1 By Product Type
- 5.1.1 Monitors
- 5.1.2 Televisions
- 5.1.3 Cameras and Digital Cinema
- 5.1.4 Laptops and Tablets
- 5.1.5 Smartphones
- 5.1.6 Projectors and Others
- 5.2 By Panel Technology
- 5.2.1 LCD (IPS, VA)
- 5.2.2 OLED
- 5.2.3 Mini-LED / Micro-LED
- 5.3 By Native Resolution
- 5.3.1 5120 X 2880 (16:9)
- 5.3.2 5120 X 3200 (16:10)
- 5.3.3 5120 X 1440 (21:9)
- 5.4 By End-user Application
- 5.4.1 Professional Content Creation
- 5.4.2 Commercial Digital Signage and Control Rooms
- 5.4.3 Consumer Gaming and Entertainment
- 5.4.4 Education and Training
- 5.4.5 Healthcare Imaging
- 5.4.6 Automotive Cockpit Displays
- 5.5 By Distribution Channel
- 5.5.1 Online (Direct, Marketplaces)
- 5.5.2 Offline (Retail, Pro-AV System Integrators)
- 5.6 By Geography
- 5.6.1 North America
- 5.6.1.1 United States
- 5.6.1.2 Canada
- 5.6.1.3 Mexico
- 5.6.2 South America
- 5.6.2.1 Brazil
- 5.6.2.2 Argentina
- 5.6.2.3 Rest of South America
- 5.6.3 Europe
- 5.6.3.1 Germany
- 5.6.3.2 United Kingdom
- 5.6.3.3 France
- 5.6.3.4 Italy
- 5.6.3.5 Spain
- 5.6.3.6 Rest of Europe
- 5.6.4 Asia-Pacific
- 5.6.4.1 China
- 5.6.4.2 Japan
- 5.6.4.3 South Korea
- 5.6.4.4 India
- 5.6.4.5 Australia
- 5.6.4.6 New Zealand
- 5.6.4.7 Rest of Asia-Pacific
- 5.6.5 Middle East and Africa
- 5.6.5.1 United Arab Emirates
- 5.6.5.2 Saudi Arabia
- 5.6.5.3 South Africa
- 5.6.5.4 Rest of Middle East and Africa
- 5.6.1 North America
6 COMPETITIVE LANDSCAPE
- 6.1 Strategic Developments
- 6.2 Vendor Positioning Analysis
- 6.3 Company Profiles (includes Global level Overview, Market level overview, Core Segments, Financials as available, Strategic Information, Products and Services, and Recent Developments)
- 6.3.1 Apple Inc.
- 6.3.2 Dell Technologies
- 6.3.3 HP Inc.
- 6.3.4 LG Electronics Inc.
- 6.3.5 Samsung Electronics Co. Ltd.
- 6.3.6 Sony Group Corp.
- 6.3.7 Koninklijke Philips N.V.
- 6.3.8 ASUSTeK Computer Inc.
- 6.3.9 Micro-Star International Co. Ltd.
- 6.3.10 Red Digital Cinema LLC
- 6.3.11 Canon Inc.
- 6.3.12 Sharp Corp.
- 6.3.13 ViewSonic Corp.
- 6.3.14 BOE Technology Group Co. Ltd.
- 6.3.15 AU Optronics Corp.
- 6.3.16 TCL CSOT
- 6.3.17 BenQ Corp.
- 6.3.18 EIZO Corp.
- 6.3.19 Panasonic Holdings Corp.
- 6.3.20 Vizio Holding Corp.
7 MARKET OPPORTUNITIES AND FUTURE OUTLOOK
- 7.1 White-space and Unmet-Need Assessment

