PUBLISHER: Mordor Intelligence | PRODUCT CODE: 2119756

PUBLISHER: Mordor Intelligence | PRODUCT CODE: 2119756
Aviation Analytics - Market Share Analysis, Industry Trends & Statistics, Growth Forecasts (2026 - 2031)
According to Mordor Intelligence, aviation analytics market size in 2026 is estimated at USD 4.2 billion, growing from 2025 value of USD 3.74 billion with 2031 projections showing USD 7.47 billion, growing at 12.21% CAGR over 2026-2031.
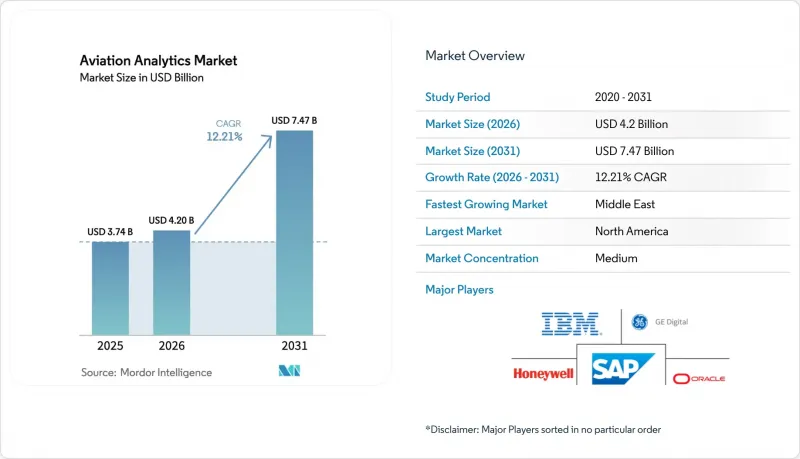
This report Segments the Industry Into End User (Airlines and Airports), Business Function (Sales and Marketing, Finance, and More), Application (Risk Management, and More), Analytics Type (Descriptive Analytics, and More), Deployment (On-Premises and Cloud), Component (Software and Services) and Geography (North America, Europe, and More). The Market Forecasts are Provided in Terms of Value (USD).
Global Aviation Analytics Market Trends and Insights
Adoption of Predictive Maintenance to Cut AOG Losses
Airlines connect aircraft to cloud-based diagnostics that analyze real-time sensor feeds and flag impending faults. Airbus estimates predictive programs could save operators USD 4 billion annually by 2043 as 11,600 aircraft stream data into its Skywise ecosystem. United Airlines has demonstrated schedule-reliability gains after scaling fleet health analytics, while Collins Aerospace reports a 30% reduction in maintenance-driven delays through its Ascentia platform. Veryon Diagnostics notes a 50% drop in troubleshooting time and a 10% cut in delays after embedding AI models that learn from historical part failures. As predictive insights mature, airlines shift from interval-based to condition-based maintenance, freeing labor capacity and spare-parts inventory.
Fuel-Burn Optimization Amid SAF Cost Pressures
Sustainable Aviation Fuel prices sit well above conventional jet fuel, intensifying the need for granular efficiency analytics. Virgin Atlantic's 100% SAF transatlantic flight saved 95 tonnes of CO2, validating data-driven flight-planning techniques. Alaska Airlines employs AI to refine track selection and descent profiles, lowering emissions while maintaining on-time performance. Boeing's Fuel Analytics module analyses more than 650 parameters per flight, delivering 1-3% consumption savings that can top USD 1 million annually for wide-body fleets. Access to real-time SAF performance datasets enables airlines to reroute dynamically based on fuel availability and pricing differentials across hubs.
Legacy IT Silos Hamper Data Interoperability
Many established airlines run bespoke reservation, maintenance, and finance systems built over decades, resulting in fragmented data landscapes. Integrating these environments demands major investment in middleware and ETL pipelines. Lufthansa broke through this constraint by linking over 10 ERP instances to a unified procurement analytics layer, unlocking spend visibility across the group. Nevertheless, change-management hurdles and competing budget priorities slow migration toward real-time enterprise architectures that fully exploit analytics potential.
Other drivers and restraints analyzed in the detailed report include:
- Big-Data Monetization from New-Gen Aircraft Sensors
- Safety-Management Mandates Driving FDM Analytics
- Shortage of Aviation-Savvy Data Scientists
For complete list of drivers and restraints, kindly check the Table Of Contents.
Segment Analysis
The aviation analytics market size attributed to airlines reached USD 2.03 billion in 2025, equal to 54.32% of global revenue. Full-service carriers invest in integrated revenue-management engines, which boosted operating income at Delta Air Lines by 10% after full cloud migration. Low-cost operators apply dynamic ancillary-pricing algorithms; airBaltic raised passenger spending by 6% through AI-guided offers. Cargo airlines deploy route-optimization tools to mitigate volatility in fuel and charter rates.
Although smaller in absolute terms, airports register a 15.05% CAGR to 2031. Large hubs automate baggage tracing with IDEMIA and SITA's ALIX solution, lifting match accuracy and reducing mishandled bags. Medium hubs such as Orlando International handle 2,800 bags per hour through computer-vision sorting belts. Regional airports embrace cloud dashboards to visualise queue times and asset utilization, narrowing the technology gap with metropolitan gateways and reinforcing an analytics adoption cycle.
Fuel management contributed 29.55% of the aviation analytics market share in 2025 and is expected to maintain the lead with a 14.08% CAGR, the highest among application groups. Boeing's Fuel Analytics interrogates 200 standard analyses per leg to detect drag-producing events and recommend optimised speeds. Airlines link these insights with procurement datasets to align hedging strategies, amplifying financial returns. Inventory-management modules reduce surplus spares by up to 30%, freeing working capital for newer digital tools.
Flight-safety analytics benefit from regulatory scrutiny. Teledyne Controls reveals a strong correlation between expanded FDM coverage and declining approach-and-landing incidents. Risk-management analytics embed AI to forecast knock-on delays caused by storms, enabling proactive crewing and gate assignment. Disruption-management platforms from Amadeus shorten recovery windows when events still occur, protecting network integrity and passenger goodwill.
Complete Report Scope:
- By End User
- Airlines
- Full-Service Carriers
- Low-Cost Carriers
- Cargo and Charter Operators
- Airports
- Large Hub Airports
- Medium Hub Airports
- Small and Regional Airports
- Airlines
- By Application
- Risk Management
- Inventory Management
- Fuel Management
- Revenue Management
- Customer Analytics
- Flight Safety Analytics
- Crew Management
- Disruption Management
- By Analytics Type
- Descriptive Analytics
- Diagnostic Analytics
- Predictive Analytics
- Prescriptive Analytics
- By Deployment
- On-Premises
- Cloud
- By Component
- Software
- Services
- Managed Services
- Professional Services
- By Business Function
- Sales and Marketing
- Finance
- MRO Operations
- Supply Chain
- Flight Operations
- Network Planning and Scheduling
- By Geography
- North America
- United States
- Canada
- Mexico
- Europe
- United Kingdom
- Germany
- France
- Rest of Europe
- Asia-Pacific
- China
- India
- Japan
- South Korea
- Rest of Asia-Pacific
- South America
- Brazil
- Rest of South America
- Middle East and Africa
- Middle East
- Saudi Arabia
- United Arab Emirates
- Rest of Middle East
- Africa
- South Africa
- Rest of Africa
- Middle East
- North America
Geography Analysis
North America contributed 35.21% of the 2025 global revenue, supported by early passenger-data connectivity and the presence of major aerospace OEMs. United Airlines extended predictive maintenance to its entire narrow-body fleet, improving on-time departures, while Alaska Airlines harnessed AI for route upslope adjustments that save fuel on Seattle departures. FAA guidance on AI and cybersecurity gives carriers regulatory clarity, but rising attack frequency prompts renewed investment in perimeter defenses.
Asia-Pacific presents a multifaceted outlook. China and India ramp up analytics around growing domestic networks, whereas Japan and South Korea integrate datasets from aging and next-gen aircraft to secure fleet-wide efficiencies. Thailand's airport-expansion plan relies on passenger-flow dashboards to keep queue times below regulatory thresholds, underscoring rising demand for real-time situational awareness.
The Middle East records the fastest 11.31% CAGR as fleets double under Vision 2030 initiatives. Seat capacity in the region rose from 70 million in 2000 to 257 million in 2024, with Emirates and Qatar Airways adopting integrated network-planning suites to balance hub-bank waves. Saudi Arabia's launch of Riyadh Air adds further complexity, making prescriptive crew-pairing tools essential to keep utilization high. Airport operators in Dubai and Doha deploy computer-vision platforms that track passenger density and adjust resource rosters in real time.
Latin America and Africa show accelerating adoption from low bases. LATAM implements intelligent pricing, while Ethiopian Airlines introduces cloud-based maintenance logs to support regional MRO growth. Currency volatility and uneven connectivity infrastructure temper deployment speed, yet partnerships with global platform providers lower entry barriers and encourage phased rollouts across secondary hubs.
- Airbus SE
- The Boeing Company
- GE Digital (General Electric Company)
- Honeywell International Inc.
- Collins Aerospace (RTX Corporation)
- International Business Machines Corporation (IBM)
- Oracle Corporation
- SAP SE
- SITA
- Amadeus IT Group, S.A.
- Palantir Technologies Inc.
- OAG Aviation Worldwide Limited
- Sabre GLBL Inc.
- IFS World Operations AB
- Swiss-AS
- Ramco Systems Ltd.
- OpenAirlines
- Skymetrix
- Osprey Flight Solutions (Sora Risk Solutions Limited)
- L3Harris Technologies, Inc.
- Luxoft Holding, Inc.
- Cloud Software Group, Inc. (TIBCO)
- PROS, Inc.
Additional Benefits:
- The market estimate (ME) sheet in Excel format
- 3 months of analyst support
TABLE OF CONTENTS
1 INTRODUCTION
- 1.1 Study Assumptions and Market Definition
- 1.2 Scope of the Study
2 RESEARCH METHODOLOGY
3 EXECUTIVE SUMMARY
4 MARKET LANDSCAPE
- 4.1 Market Overview
- 4.2 Market Drivers
- 4.2.1 Adoption of predictive maintenance to cut AOG losses
- 4.2.2 Fuel-burn optimization amid SAF cost pressures
- 4.2.3 Big-data monetization from new-gen aircraft sensors
- 4.2.4 Safety-management mandates driving FDM analytics
- 4.2.5 Real-time SAF performance datasets enabling dynamic routing
- 4.2.6 Edge-AI telemetry from eVTOL fleets creating micro-service analytics demand
- 4.3 Market Restraints
- 4.3.1 Legacy IT silos hamper data interoperability
- 4.3.2 Shortage of aviation-savvy data scientists
- 4.3.3 Cyber-risk of streaming flight data to cloud
- 4.3.4 Passenger-privacy rules limiting behavioural analytics
- 4.4 Value Chain Analysis
- 4.5 Regulatory Landscape
- 4.6 Technological Outlook
- 4.7 Porter's Five Forces Analysis
- 4.7.1 Bargaining Power of Suppliers
- 4.7.2 Bargaining Power of Buyers/Consumers
- 4.7.3 Threat of New Entrants
- 4.7.4 Threat of Substitutes
- 4.7.5 Intensity of Competitive Rivalry
5 MARKET SIZE AND GROWTH FORECASTS (VALUE)
- 5.1 By End User
- 5.1.1 Airlines
- 5.1.1.1 Full-Service Carriers
- 5.1.1.2 Low-Cost Carriers
- 5.1.1.3 Cargo and Charter Operators
- 5.1.2 Airports
- 5.1.2.1 Large Hub Airports
- 5.1.2.2 Medium Hub Airports
- 5.1.2.3 Small and Regional Airports
- 5.1.1 Airlines
- 5.2 By Application
- 5.2.1 Risk Management
- 5.2.2 Inventory Management
- 5.2.3 Fuel Management
- 5.2.4 Revenue Management
- 5.2.5 Customer Analytics
- 5.2.6 Flight Safety Analytics
- 5.2.7 Crew Management
- 5.2.8 Disruption Management
- 5.3 By Analytics Type
- 5.3.1 Descriptive Analytics
- 5.3.2 Diagnostic Analytics
- 5.3.3 Predictive Analytics
- 5.3.4 Prescriptive Analytics
- 5.4 By Deployment
- 5.4.1 On-Premises
- 5.4.2 Cloud
- 5.5 By Component
- 5.5.1 Software
- 5.5.2 Services
- 5.5.2.1 Managed Services
- 5.5.2.2 Professional Services
- 5.6 By Business Function
- 5.6.1 Sales and Marketing
- 5.6.2 Finance
- 5.6.3 MRO Operations
- 5.6.4 Supply Chain
- 5.6.5 Flight Operations
- 5.6.6 Network Planning and Scheduling
- 5.7 By Geography
- 5.7.1 North America
- 5.7.1.1 United States
- 5.7.1.2 Canada
- 5.7.1.3 Mexico
- 5.7.2 Europe
- 5.7.2.1 United Kingdom
- 5.7.2.2 Germany
- 5.7.2.3 France
- 5.7.2.4 Rest of Europe
- 5.7.3 Asia-Pacific
- 5.7.3.1 China
- 5.7.3.2 India
- 5.7.3.3 Japan
- 5.7.3.4 South Korea
- 5.7.3.5 Rest of Asia-Pacific
- 5.7.4 South America
- 5.7.4.1 Brazil
- 5.7.4.2 Rest of South America
- 5.7.5 Middle East and Africa
- 5.7.5.1 Middle East
- 5.7.5.1.1 Saudi Arabia
- 5.7.5.1.2 United Arab Emirates
- 5.7.5.1.3 Rest of Middle East
- 5.7.5.2 Africa
- 5.7.5.2.1 South Africa
- 5.7.5.2.2 Rest of Africa
- 5.7.5.1 Middle East
- 5.7.1 North America
6 COMPETITIVE LANDSCAPE
- 6.1 Market Concentration
- 6.2 Strategic Moves
- 6.3 Market Share Analysis
- 6.4 Company Profiles (includes Global level Overview, Market level overview, Core Segments, Financials as available, Strategic Information, Market Rank/Share for key companies, Products and Services, and Recent Developments)
- 6.4.1 Airbus SE
- 6.4.2 The Boeing Company
- 6.4.3 GE Digital (General Electric Company)
- 6.4.4 Honeywell International Inc.
- 6.4.5 Collins Aerospace (RTX Corporation)
- 6.4.6 International Business Machines Corporation (IBM)
- 6.4.7 Oracle Corporation
- 6.4.8 SAP SE
- 6.4.9 SITA
- 6.4.10 Amadeus IT Group, S.A.
- 6.4.11 Palantir Technologies Inc.
- 6.4.12 OAG Aviation Worldwide Limited
- 6.4.13 Sabre GLBL Inc.
- 6.4.14 IFS World Operations AB
- 6.4.15 Swiss-AS
- 6.4.16 Ramco Systems Ltd.
- 6.4.17 OpenAirlines
- 6.4.18 Skymetrix
- 6.4.19 Osprey Flight Solutions (Sora Risk Solutions Limited)
- 6.4.20 L3Harris Technologies, Inc.
- 6.4.21 Luxoft Holding, Inc.
- 6.4.22 Cloud Software Group, Inc. (TIBCO)
- 6.4.23 PROS, Inc.
7 MARKET OPPORTUNITIES AND FUTURE OUTLOOK
- 7.1 White-space and Unmet-Need Assessment

