PUBLISHER: Mordor Intelligence | PRODUCT CODE: 2119841

PUBLISHER: Mordor Intelligence | PRODUCT CODE: 2119841
Micro Lending - Market Share Analysis, Industry Trends & Statistics, Growth Forecasts (2026 - 2031)
According to Mordor Intelligence, the micro lending market size was valued at USD 236.18 billion in 2025 and estimated to grow from USD 260.8 billion in 2026 to reach USD 428.3 billion by 2031, at a CAGR of 10.42% during the forecast period (2026-2031).
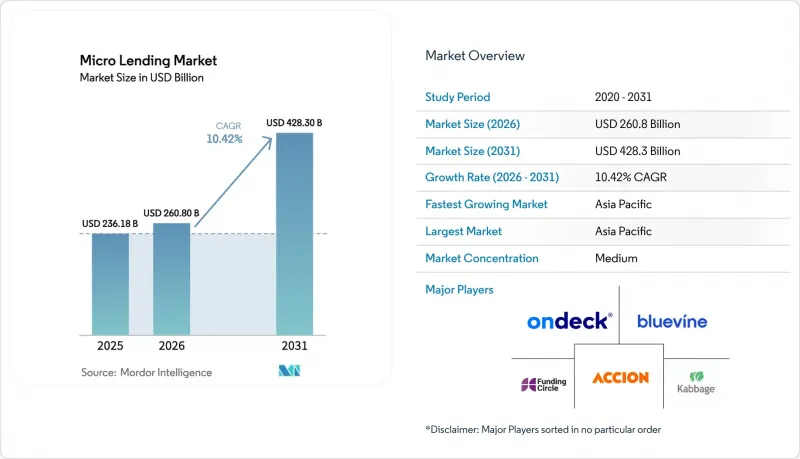
This report is Segmented by Institution (Banks, and Micro-Finance Institutions (MFIs) and Others), by End-Users (Businesses and Retail (Consumers)), by Channel (Online and Offline), and by Region (North America, South America, Europe, Asia-Pacific, and Middle East and Africa). The Market Forecasts are Provided in Terms of Value (USD).
Global Micro Lending Market Trends and Insights
Fintech & Mobile-first Customer Acquisition Boom
Mobile-centric lenders deploy AI to analyze more than 70,000 data points from devices, thereby scoring thin-file borrowers at scale. Customer acquisition costs are 60-70% lower than branch models, permitting profitable ticket sizes as small as USD 40 while maintaining default rates near 5% . Success in Kenya and Mexico illustrates how rapid disbursement deepens client income and loyalty, reinforcing a virtuous cycle of repeat borrowing. Fintech scalability continues to pull capital into the micro lending market, especially as platforms prove that digital repayment footprints create predictive risk signals. The result is a rising share of micro lending market originations occurring entirely on smartphones, with lenders in markets such as the Philippines onboarding 1 million customers in 10 months.
Government Financial Inclusion Mandates & Subsidies
Policies such as India's Open Credit Enablement Network or the U.S. National Strategy for Financial Inclusion are lowering onboarding friction, standardizing data sharing, and offering guarantee schemes that derisk lender exposure. Collateral-free guarantee programs already cover 10 million loans, catalyzing business lending demand that dominates the micro lending market. Subsidized interest windows and refinancing facilities blunt pandemic-era stress, ensuring liquidity to smaller MFIs. Over the long term, coordinated frameworks that link identity, payments, and credit are expected to expand the addressable customer pool by tens of millions.
Post-pandemic Spike in Portfolio-at-risk & Write-offs
Lockdowns disrupted cash flows for millions of micro-entrepreneurs, pushing PAR30 ratios to multi-year highs and forcing lenders to restructure sizable portions of their loan books. Africa's default rate reached 6.7% in 2024, well above the 4.1% global mean. Although repayments have gradually normalized, risk costs remain elevated for rural and informal borrowers, limiting immediate balance-sheet growth. Providers with diversified funding and granular data tracking have resumed originations faster, but the episode reinforces the sensitivity of the micro lending market to external shocks.
Other drivers and restraints analyzed in the detailed report include:
- Surge in Impact/ESG-linked Micro-credit Funds
- Expansion of P2P / Marketplace Platforms into MSE Lending
- Rate Caps & Tightening Consumer-protection Rules
For complete list of drivers and restraints, kindly check the Table Of Contents.
Segment Analysis
MFIs and other non-bank lenders commanded 61.45% of the micro lending market share in 2025, and the segment is projected to compound at 12.28% annually through 2031. The segment's dominance is rooted in low operating costs, mission-aligned funding, and field-agent intimacy that sustain loyalty among thin-file borrowers. Those attributes translate into quick disbursement and flexible repayment options, giving MFIs a cost-to-income advantage of 10-15 percentage points over banks in comparable ticket sizes.
Banks maintain relevance through partnerships, captive subsidiaries, and securitization channels that recycle on-balance-sheet portfolios into capital-market paper. Yet Basel III capital inflation of 4.9% for European Group 1 banks continues to divert scarce lending headroom toward lower-risk asset classes, indirectly steering smaller borrowers toward specialized MFIs. Securitization hubs such as Luxembourg offer a liquidity valve by converting seasoned micro-loan pools into tradable instruments, a model that now represents roughly 8% of the micro lending market size traded in secondary form.
Complete Report Scope:
- By Institution
- Banks
- Micro-Finance Institutions (MFIs) and Others
- By End-Users
- Businesses
- Retail (Consumers)
- By Channel
- Online
- Offline
- By Region
- North America
- United States
- Canada
- Mexico
- South America
- Brazil
- Argentina
- Chile
- Colombia
- Rest of South America
- Europe
- United Kingdom
- Germany
- France
- Spain
- Italy
- Benelux (Belgium, Netherlands, and Luxembourg)
- Nordics (Sweden, Norway, Denmark, Finland, and Iceland)
- Rest of Europe
- Asia-Pacific
- China
- India
- Japan
- South Korea
- Australia
- South-East Asia (Singapore, Indonesia, Malaysia, Thailand, Vietnam, and Philippines)
- Rest of Asia-Pacific
- Middle East and Africa
- United Arab Emirates
- Saudi Arabia
- South Africa
- Nigeria
- Rest of Middle East and Africa
- North America
Geography Analysis
Asia-Pacific held 43.20% share of the micro lending market in 2025 and is projected to compound at 12.74% through 2031. Massive unbanked populations and real-time payment rails like India's UPI create fertile ground for scale. Government programs anchor demand: Jan Dhan accounts surpass 500 million, offering lenders authenticated identity and transaction histories that compress KYC costs by 80%. Fintech partnerships embed credit within everyday super-apps, making India, Indonesia, and the Philippines hotspots for digital disbursement.
Latin America and the Caribbean contribute a smaller yet rapidly expanding slice of the micro lending market. IDB-backed investments funnel capital to women-owned businesses, and companies such as Tala leverage alternative data to underwrite 3 million Mexican customers with USD 500 million disbursed in 2024. Institutional trust markedly influences digital adoption; individuals expressing higher trust show a 62% greater likelihood of using mobile payments. That trust dividend underpins robust loan growth as borrowers migrate from payday shops to app-based credit.
Sub-Saharan Africa combines opportunity with portfolio risk. Mobile-money rails pioneered in Kenya yield unrivaled distribution reach, yet climate-induced crop failures raise defaults in agri books. Regional default rates stayed elevated at 6.7% in 2024, compared with the micro lending market global average of 4.1%. Innovative hybrids like micro-insurance plus micro-credit aim to hedge weather shocks, and regulators encourage digital sandboxes to test such solutions. Over time, improved risk pooling is expected to narrow loss-given-default and unlock further expansion.
- Accion International
- BlueVine Inc.
- Funding Circle
- Kabbage Inc.
- OnDeck
- Fundbox
- LendingClub Bank
- Zopa Bank Ltd.
- Grameen Bank
- Kiva
- Bandhan Bank
- CreditAccess Grameen
- VisionFund International
- Banco Compartamos (Gentera)
- FINCA International
- Ujjivan Small Finance Bank
- Tala
- Jumo
- Karandaaz
- Musoni
Additional Benefits:
- The market estimate (ME) sheet in Excel format
- 3 months of analyst support
TABLE OF CONTENTS
1 Introduction
- 1.1 Study Assumptions & Market Definition
- 1.2 Scope of the Study
2 Research Methodology
3 Executive Summary
4 Market Landscape
- 4.1 Market Overview
- 4.2 Market Drivers
- 4.2.1 Fin-tech & Mobile-first customer acquisition boom
- 4.2.2 Government financial-inclusion mandates & subsidies
- 4.2.3 Surge in impact/ESG-linked micro-credit funds
- 4.2.4 Expansion of P2P / marketplace platforms into MSE lending
- 4.2.5 Embedded-finance loans at e-commerce & POS check-out
- 4.2.6 AI-based alternative-data scoring unlocking "thin-file" borrowers
- 4.3 Market Restraints
- 4.3.1 Post-pandemic spike in portfolio-at-risk & write-offs
- 4.3.2 Rate-caps & tightening consumer-protection rules
- 4.3.3 Climate-driven agri borrower defaults in rural cohorts
- 4.3.4 Basel-III risk-weight hikes starving tier-2 MFIs of bank credit
- 4.4 Value / Supply-Chain Analysis
- 4.5 Regulatory Landscape
- 4.6 Technological Outlook
- 4.7 Porter's Five Forces
- 4.7.1 Bargaining Power of Buyers
- 4.7.2 Bargaining Power of Suppliers
- 4.7.3 Threat of New Entrants
- 4.7.4 Threat of Substitutes
- 4.7.5 Intensity of Competitive Rivalry
5 Market Size & Growth Forecasts (Value)
- 5.1 By Institution
- 5.1.1 Banks
- 5.1.2 Micro-Finance Institutions (MFIs) and Others
- 5.2 By End-Users
- 5.2.1 Businesses
- 5.2.2 Retail (Consumers)
- 5.3 By Channel
- 5.3.1 Online
- 5.3.2 Offline
- 5.4 By Region
- 5.4.1 North America
- 5.4.1.1 United States
- 5.4.1.2 Canada
- 5.4.1.3 Mexico
- 5.4.2 South America
- 5.4.2.1 Brazil
- 5.4.2.2 Argentina
- 5.4.2.3 Chile
- 5.4.2.4 Colombia
- 5.4.2.5 Rest of South America
- 5.4.3 Europe
- 5.4.3.1 United Kingdom
- 5.4.3.2 Germany
- 5.4.3.3 France
- 5.4.3.4 Spain
- 5.4.3.5 Italy
- 5.4.3.6 Benelux (Belgium, Netherlands, and Luxembourg)
- 5.4.3.7 Nordics (Sweden, Norway, Denmark, Finland, and Iceland)
- 5.4.3.8 Rest of Europe
- 5.4.4 Asia-Pacific
- 5.4.4.1 China
- 5.4.4.2 India
- 5.4.4.3 Japan
- 5.4.4.4 South Korea
- 5.4.4.5 Australia
- 5.4.4.6 South-East Asia (Singapore, Indonesia, Malaysia, Thailand, Vietnam, and Philippines)
- 5.4.4.7 Rest of Asia-Pacific
- 5.4.5 Middle East and Africa
- 5.4.5.1 United Arab Emirates
- 5.4.5.2 Saudi Arabia
- 5.4.5.3 South Africa
- 5.4.5.4 Nigeria
- 5.4.5.5 Rest of Middle East and Africa
- 5.4.1 North America
6 Competitive Landscape
- 6.1 Market Concentration
- 6.2 Strategic Moves
- 6.3 Market Share Analysis
- 6.4 Company Profiles (includes Global Level Overview, Market Level Overview, Core Segments, Financials as available, Strategic Information, Market Rank/Share for Key Companies, Products & Services, and Recent Developments)
- 6.4.1 Accion International
- 6.4.2 BlueVine Inc.
- 6.4.3 Funding Circle
- 6.4.4 Kabbage Inc.
- 6.4.5 OnDeck
- 6.4.6 Fundbox
- 6.4.7 LendingClub Bank
- 6.4.8 Zopa Bank Ltd.
- 6.4.9 Grameen Bank
- 6.4.10 Kiva
- 6.4.11 Bandhan Bank
- 6.4.12 CreditAccess Grameen
- 6.4.13 VisionFund International
- 6.4.14 Banco Compartamos (Gentera)
- 6.4.15 FINCA International
- 6.4.16 Ujjivan Small Finance Bank
- 6.4.17 Tala
- 6.4.18 Jumo
- 6.4.19 Karandaaz
- 6.4.20 Musoni
7 Market Opportunities & Future Outlook
- 7.1 White-space & Unmet-Need Assessment

