PUBLISHER: Mordor Intelligence | PRODUCT CODE: 2120275

PUBLISHER: Mordor Intelligence | PRODUCT CODE: 2120275
Airport Passenger Screening Systems - Market Share Analysis, Industry Trends & Statistics, Growth Forecasts (2026 - 2031)
According to Mordor Intelligence, the airport passenger screening systems market size in 2026 is estimated at USD 3.11 billion, growing from 2025 value of USD 2.84 billion with 2031 projections showing USD 4.92 billion, growing at 9.61% CAGR over 2026-2031.
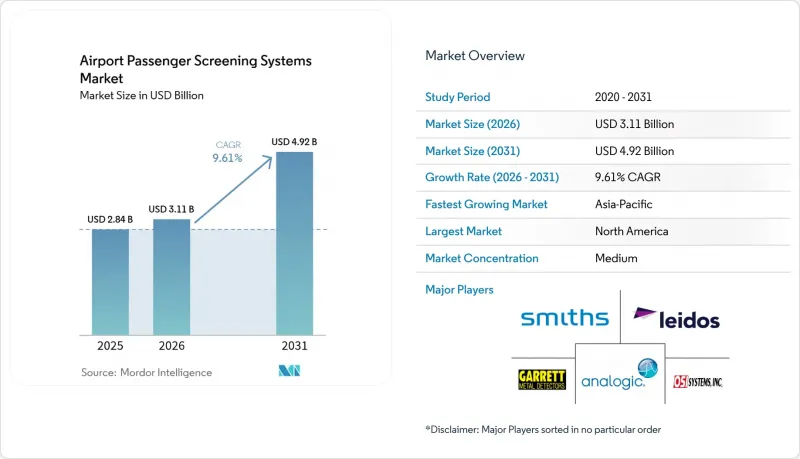
This report is Segmented by Type (Metal Detectors, Full Body Scanners, and Advancing Imaging Technology), Component (Hardware and Software), Deployment Mode (Primary Passenger Checkpoint, Secondary/Randomized Screening, and Others), Airport Hub Size (Large, Medium, and Small), and Geography (North America, Europe, and More). The Market Forecasts are Provided in Terms of Value (USD).
Global Airport Passenger Screening Systems Market Trends and Insights
Rising Passenger Traffic Pushing Demand for High-Throughput Systems
Asia-Pacific airports processed more than 3 billion passengers in 2024, surpassing 2019 throughput and intensifying the need for equipment that screens 300-plus travelers per hour while upholding stringent detection standards. Middle-Eastern megaprojects valued near USD 1 trillion incorporate bright corridors that fuse biometrics with AI detection, illustrating how traffic growth directly converts into capital orders for advanced CT and mmWave scanners. Airports in emerging markets favor scalable, software-upgradable platforms to keep pace with double-digit passenger growth, whereas mature North American hubs concentrate on workflow optimization. The direct link between volume and security investment has strengthened since 2024 as operators measure checkpoint performance on risk mitigation and queue-time metrics. Consequently, the airport passenger screening systems market increasingly rewards vendors capable of proving throughput gains alongside compliance credentials.
Regulatory Mandates for CT Deployment
TSA requires Category X checkpoints to convert to CT by 2026 and has earmarked USD 2.8 billion solely for acquisition and installation, guaranteeing a multi-year procurement pipeline. The European Commission's September 2024 re-imposition of liquid restrictions on airports lacking C3 CT accelerated EU rollouts. ICAO's 2024 Global Aviation Security Plan endorses CT as the reference standard for its 193 member states. These mandates extend to employee screening under TSA's Rap Back program, producing secondary demand beyond primary lanes. Noncompliance penalties compel rapid tenders, channeling share toward suppliers with certified solutions and global support. As a result, the airport passenger screening systems market sees forecastable surges just ahead of each regulatory deadline.
Legacy Infrastructure Limiting Space, Power, Weight
Roughly 40% of leading international airports opened before 1980 and lack the floor space, electrical capacity, or structural strength to house CT gear that occupies 15-20% more area and draws triple the power of legacy X-ray units. Terminal modifications can exceed USD 500,000 per lane and cause daily disruption losses topping USD 100,000 at peak hubs. Weight limits on elevated checkpoints further complicate installs, especially in multi-level European and Asian terminals. These constraints delay rollouts and temper growth potential within the airport passenger screening systems market until retrofit budgets or greenfield projects catch up.
Other drivers and restraints analyzed in the detailed report include:
- Modernization Programs Integrating Biometric Identity
- Retrofit Friendly Technologies Lowering Upgrade Costs
- Rising Cybersecurity and Privacy Compliance Costs
For complete list of drivers and restraints, kindly check the Table Of Contents.
Segment Analysis
The airport passenger screening systems market size for metal detectors reached a 35.12% share in 2025, yet CT-based advanced imaging technology is poised for the strongest 9.78% CAGR to 2031. Airport managers gravitate to CT for 3D imaging that clears liquids and electronics without unpacking, boosting lane throughput by up to 20%. Full-body mmWave scanners have reached saturation at many hubs, but AI-assisted pattern recognition is lifting detection accuracy and lowering false alarms. ICAO's endorsement of CT as best practice cements its role, while retrofittable units broaden access for mid-tier airports. Continuous software upgrades let operators refine threat libraries without swapping hardware, sustaining lifecycle value within the airport passenger screening systems market.
CT's cost premium narrows as production scales and as regulators fund procurement. Meanwhile, traditional walk-through metal detectors preserve relevance for perimeter checks, employee entries, and budget-constrained terminals. Hybrid lane designs that pair metal detection with CT or mmWave equipment maximize capacity and flex to risk ratings. Therefore, vendors that package multi-technology portfolios capture broader wallet shares across airport growth stages.
Hardware accounted for 71.60% revenue in 2025 because scanners, conveyors, and cabling require the bulk of capital outlay. Yet software revenues are expanding at a 10.05% CAGR as algorithms underpin predictive threat analysis, automatic image interpretation, and condition-based maintenance. The airport passenger screening systems market size attributed to analytics is further lifted by subscription licenses that deliver real-time upgrades and cybersecurity patches.
Edge processing removes reliance on cloud round-trips, meeting data sovereignty rules while shrinking latency to milliseconds-vital for 250-plus passenger-per-hour lanes. Algorithm performance depends on abundant operational data, giving incumbents with decades of scans a moat against new entrants. DHS Science & Technology grants of USD 27.55 million for quantum-sensing and AI research underscore the government's appetite for software-led detection breakthroughs. Hardware suppliers that open APIs to independent software vendors multiply innovation, yet must safeguard certification integrity to retain airport trust.
Complete Report Scope:
- By Type
- Metal Detectors
- Full Body Scanners
- Advancing Imaging Technology
- By Component
- Hardware
- Software
- By Deployment Mode
- Primary Passenger Checkpoint
- Secondary/Randomized Screening
- Others
- By Airport Hub Size
- Large
- Medium
- Small
- By Geography
- North America
- United States
- Canada
- Mexico
- Europe
- United Kingdom
- France
- Germany
- Spain
- Rest of Europe
- Asia-Pacific
- China
- India
- Japan
- Australia
- Rest of Asia-Pacific
- South America
- Brazil
- Rest of South America
- Middle East and Africa
- Middle East
- United Arab Emirates
- Saudi Arabia
- Rest of Middle East
- Africa
- South Africa
- Rest of Africa
- Middle East
- North America
Geography Analysis
North America generated 33.10% of global revenue in 2025, owing to the TSA's USD 10.7 billion modernization pipeline and mature infrastructure undergoing systematic refresh cycles. CAT identity technology now scans more than 3 million IDs monthly, and CT lanes are extending from flagship hubs to regional spokes. Canada and Mexico align rulesets with US standards, creating an integrated North American procurement theater that benefits suppliers certified by the TSA.
Asia-Pacific delivers the fastest 10.28% CAGR, fueled by China and India's airport-construction drives. By 2024, passenger totals will already be 103% of 2019 benchmarks. Greenfield terminals embed CT, biometrics, and AI from day one, bypassing legacy constraints. Government stimulus under smart-city plans adds funding for edge analytics and cloud dashboards, broadening the airport passenger screening systems market. Mature markets like Japan and Australia pursue upgrades that embed AI threat libraries and privacy safeguards.
Europe sustains mid-single-digit growth under harmonized ECAC rules and the 2024 liquid-restriction reinstatement for airports lacking C3 CT. GDPR shapes biometric rollouts, prompting on-prem solutions and explicit consent flows. Meanwhile, the Middle East and Africa leverage USD 1 trillion in planned capacity to showcase biometric-plus-AI smart gates that clear 95% of travelers hands-free. Diverse regulatory cadence demands flexible certification strategies from vendors looking to capture global share.
- Smiths Group plc
- OSI Systems, Inc.
- Analogic Corporation
- Garrett Electronics Inc.
- CEIA S.p.A.
- Nuctech Technology Co., Ltd.
- Leidos, Inc.
- Rohde & Schwarz GmbH & Co. KG
- Liberty Defense Holdings Ltd.
- Astrophysics, Inc.
- Tek84, Inc.
- Vanderlande Industries B.V.
- Thales Group
- Autoclear LLC
- Kromek Group plc
Additional Benefits:
- The market estimate (ME) sheet in Excel format
- 3 months of analyst support
TABLE OF CONTENTS
1 INTRODUCTION
- 1.1 Study Assumptions and Market Definition
- 1.2 Scope of the Study
2 RESEARCH METHODOLOGY
3 EXECUTIVE SUMMARY
4 MARKET LANDSCAPE
- 4.1 Market Overview
- 4.2 Market Drivers
- 4.2.1 Growth in global air passenger traffic increasing demand for advanced screening technologies
- 4.2.2 Implementation of regulatory mandates driving adoption of computed tomography (CT) systems
- 4.2.3 Modernization initiatives promoting deployment of advanced identity authentication solutions
- 4.2.4 Emergence of retrofit-friendly technologies reducing infrastructure upgrade costs
- 4.2.5 Integration of AI in millimeter-wave (mmWave) systems enhancing real-time threat detection capabilities
- 4.2.6 Expansion of airport security protocols to include employee screening operations
- 4.3 Market Restraints
- 4.3.1 Physical and infrastructure limitations at airports hindering technology deployment
- 4.3.2 Rising cybersecurity and data compliance costs impacting biometric system integration
- 4.3.3 Public concerns regarding privacy and health risks associated with certain scanning technologies
- 4.3.4 Escalating component costs affecting affordability of next-generation screening systems
- 4.4 Value Chain Analysis
- 4.5 Regulatory Landscape
- 4.6 Technological Outlook
- 4.7 Porter's Five Forces Analysis
- 4.7.1 Bargaining Power of Buyers
- 4.7.2 Bargaining Power of Suppliers
- 4.7.3 Threat of New Entrants
- 4.7.4 Threat of Substitutes
- 4.7.5 Intensity of Competitive Rivalry
5 MARKET SIZE AND GROWTH FORECASTS (VALUE)
- 5.1 By Type
- 5.1.1 Metal Detectors
- 5.1.2 Full Body Scanners
- 5.1.3 Advancing Imaging Technology
- 5.2 By Component
- 5.2.1 Hardware
- 5.2.2 Software
- 5.3 By Deployment Mode
- 5.3.1 Primary Passenger Checkpoint
- 5.3.2 Secondary/Randomized Screening
- 5.3.3 Others
- 5.4 By Airport Hub Size
- 5.4.1 Large
- 5.4.2 Medium
- 5.4.3 Small
- 5.5 By Geography
- 5.5.1 North America
- 5.5.1.1 United States
- 5.5.1.2 Canada
- 5.5.1.3 Mexico
- 5.5.2 Europe
- 5.5.2.1 United Kingdom
- 5.5.2.2 France
- 5.5.2.3 Germany
- 5.5.2.4 Spain
- 5.5.2.5 Rest of Europe
- 5.5.3 Asia-Pacific
- 5.5.3.1 China
- 5.5.3.2 India
- 5.5.3.3 Japan
- 5.5.3.4 Australia
- 5.5.3.5 Rest of Asia-Pacific
- 5.5.4 South America
- 5.5.4.1 Brazil
- 5.5.4.2 Rest of South America
- 5.5.5 Middle East and Africa
- 5.5.5.1 Middle East
- 5.5.5.1.1 United Arab Emirates
- 5.5.5.1.2 Saudi Arabia
- 5.5.5.1.3 Rest of Middle East
- 5.5.5.2 Africa
- 5.5.5.2.1 South Africa
- 5.5.5.2.2 Rest of Africa
- 5.5.5.1 Middle East
- 5.5.1 North America
6 COMPETITIVE LANDSCAPE
- 6.1 Market Concentration
- 6.2 Strategic Moves
- 6.3 Market Share Analysis
- 6.4 Company Profiles (includes Global level Overview, Market level overview, Core Segments, Financials as available, Strategic Information, Market Rank/Share for key companies, Products and Services, and Recent Developments)
- 6.4.1 Smiths Group plc
- 6.4.2 OSI Systems, Inc.
- 6.4.3 Analogic Corporation
- 6.4.4 Garrett Electronics Inc.
- 6.4.5 CEIA S.p.A.
- 6.4.6 Nuctech Technology Co., Ltd.
- 6.4.7 Leidos, Inc.
- 6.4.8 Rohde & Schwarz GmbH & Co. KG
- 6.4.9 Liberty Defense Holdings Ltd.
- 6.4.10 Astrophysics, Inc.
- 6.4.11 Tek84, Inc.
- 6.4.12 Vanderlande Industries B.V.
- 6.4.13 Thales Group
- 6.4.14 Autoclear LLC
- 6.4.15 Kromek Group plc
7 MARKET OPPORTUNITIES AND FUTURE OUTLOOK
- 7.1 White-space and Unmet-Need Assessment

