PUBLISHER: Mordor Intelligence | PRODUCT CODE: 2120316

PUBLISHER: Mordor Intelligence | PRODUCT CODE: 2120316
Virtual Reality (VR) - Market Share Analysis, Industry Trends & Statistics, Growth Forecasts (2026 - 2031)
According to Mordor Intelligence, the virtual reality market size is projected to be USD 12.92 billion in 2025, USD 15.64 billion in 2026, and reach USD 40.71 billion by 2031, growing at a CAGR of 21.08% from 2026 to 2031.
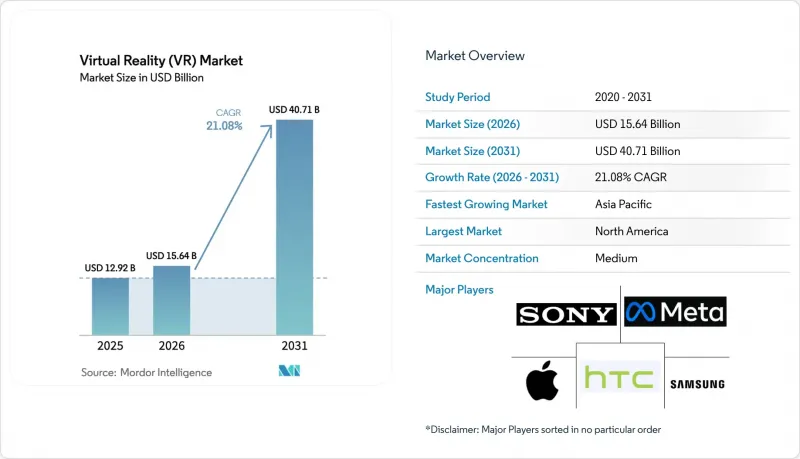
This report is Segmented by Offering (Hardware, Software, and Services), Device Form Factor (Tethered HMD, Stand-Alone HMD, and More), Immersion Level (Non-Immersive, Semi-Immersive, and Fully-Immersive), End-User Industry (Gaming, Media and Entertainment, and More), and Geography (North America, South America, and More). The Market Forecasts are Provided in Terms of Value (USD).
Global Virtual Reality (VR) Market Trends and Insights
Rising Enterprise-Wide VR Training Adoption
Simulation-based training compresses learning curves and reduces liability from on-the-job errors, motivating corporations to allocate larger budgets to immersive content. Multinationals in aviation, energy, and emergency response now deploy VR modules for tasks where a single mistake carries high human or financial cost. International quality standards such as ISO 9001 increasingly accept VR-documented competency as equivalent to physical demonstrations, streamlining compliance audits. However, many organizations still face a six-to-twelve-month lead time to create bespoke modules because skilled 3D developers remain in short supply. These content bottlenecks moderate the growth curve even as the business case strengthens.
Mainstreaming of Mixed-Reality-Ready GPUs and SoCs
Chipmakers have embedded dedicated VR processing blocks into their flagship processors, removing the price premium once associated with immersive-capable devices. Apple's M5 chip features hardware-accelerated foveated rendering, delivering desktop-class visuals in a lightweight headset. Qualcomm's Snapdragon XR2 Gen 2 platform now powers stand-alone units priced below USD 500, placing immersive hardware within reach of schools and small businesses. Lower entry costs decouple purchases from long IT refresh cycles, turning headsets into consumable peripherals. The main concern is thermal management; extended sessions still trigger eye-box heat buildup, which limits continuous use. Continuous engineering on heat dissipation and lens ventilation is therefore essential for broader workplace adoption.
Cybersickness and Long-Term Vestibular Concerns
Visual-vestibular mismatch triggers nausea, dizziness, and eye strain in 25-40% of first-time users, with 15% of acclimated users still reporting discomfort during sessions longer than 30 minutes. Enterprises must maintain parallel non-VR pathways for sensitive employees, diluting return on investment. Hardware improvements in refresh rate and latency have reached diminishing returns, so further gains require motion-prediction algorithms or pharmacological aids not yet commercially viable. Liability questions about long-term vestibular health persist due to limited longitudinal research. These factors combine to temper aggressive rollout plans, especially in healthcare and education environments.
Other drivers and restraints analyzed in the detailed report include:
- 5G and Edge-Powered Untethered VR Streaming
- Regulatory Approvals for VR-Based Mental-Health Therapies
- Data-Privacy Compliance Costs for Eye-Tracking Analytics
For complete list of drivers and restraints, kindly check the Table Of Contents.
Geography Analysis
North America generated 37.36% of the 2025 revenue, supported by a dense ecosystem comprising chipset designers, headset manufacturers, and specialized content studios. Fortune 500 manufacturers, healthcare systems, and defense contractors transitioned from pilots to full-scale rollouts in 2024-2025, integrating VR metrics into key performance dashboards. FDA approvals of therapeutic applications and the U.S. Department of Defense's investment in immersive training infrastructure sustain institutional demand. Growth moderates as early adopters saturate, shifting focus to small and mid-sized businesses that require simplified deployment and lower pricing.
The Asia Pacific is on course to register a 23.49% CAGR from 2026 to 2031, the fastest growth rate worldwide. China, Japan, South Korea, and India are leveraging VR to bridge skilled labor shortages in advanced manufacturing, deploying thousands of headsets for assembly-line instruction. South Korea's ubiquitous 5G reduces headset costs by streaming workloads from edge servers. Japan's aging population drives the uptake of elder-care rehabilitation, aided by subsidies from the Ministry of Health. India combines government skill-development grants with affordable Chinese hardware to scale training in electronics and automotive clusters. Australia and New Zealand contribute niche demand from mining and energy firms that value VR for remote-site safety drills.
Europe, South America, the Middle East, and Africa display heterogeneous trajectories. Europe wrestles with strict GDPR rules on biometric data that add compliance overhead for eye-tracking analytics, yet automotive and aerospace leaders in Germany and France still push adoption within controlled facilities. South American uptake concentrates in Brazilian and Argentine urban centers where broadband coverage supports VR labs for education and retail showrooms. The United Arab Emirates and Saudi Arabia invest heavily in VR tourism experiences linked to national economic diversification plans. African markets remain nascent, focusing on donor-funded telemedicine pilots that circumvent hospital shortages. Infrastructure quality and regulatory clarity dictate pace more than inherent interest, ensuring regional growth curves diverge widely through 2031.
- Meta Platforms (Meta Quest)
- Sony Corporation
- HTC Corporation
- Samsung Electronics Co. Ltd
- Apple Inc.
- Qualcomm Technologies Inc.
- Lenovo Group Ltd
- Pico Interactive Inc.
- Valve Corporation
- Varjo Technologies Oy
- Microsoft Corporation
- Magic Leap Inc.
- Vuzix Corporation
- FOVE Inc.
- DPVR (Lexiang Tech Co. Ltd)
- Unity Technologies Inc.
- Unreal Engine (Epic Games Inc.)
- Autodesk Inc.
- Dassault Systemes SE
- 3D Systems Corporation
Additional Benefits:
- The market estimate (ME) sheet in Excel format
- 3 months of analyst support
TABLE OF CONTENTS
1 INTRODUCTION
- 1.1 Study Assumptions and Market Definition
- 1.2 Scope of the Study
2 RESEARCH METHODOLOGY
3 EXECUTIVE SUMMARY
4 MARKET LANDSCAPE
- 4.1 Market Overview
- 4.2 Market Drivers
- 4.2.1 Rising Enterprise-Wide VR Training Adoption
- 4.2.2 Mainstreaming of Mixed Reality-Ready GPUs and SoCs
- 4.2.3 5G and Edge-Powered Untethered VR Streaming
- 4.2.4 Corporate Net-Zero Pledges Driving Virtual-First Events
- 4.2.5 Regulatory Approvals for VR-Based Mental-Health Therapies
- 4.2.6 Ultrasound-Haptics Enabling Controller-Free Interaction
- 4.3 Market Restraints
- 4.3.1 Cybersickness and Long-Term Vestibular Concerns
- 4.3.2 Eye-Box Heat Build-Up Limiting Continuous Usage
- 4.3.3 Scarcity of AAA-Grade VR Content Outside Gaming
- 4.3.4 Data-Privacy Compliance Costs for Eye-Tracking Analytics
- 4.4 Industry Value Chain Analysis
- 4.5 Regulatory Landscape
- 4.6 Technological Outlook
- 4.7 Porter's Five Forces Analysis
- 4.7.1 Bargaining Power of Suppliers
- 4.7.2 Bargaining Power of Buyers
- 4.7.3 Threat of New Entrants
- 4.7.4 Threat of Substitutes
- 4.7.5 Intensity of Competitive Rivalry
- 4.8 Impact of Macroeconomic Factors on the Market
5 MARKET SIZE AND GROWTH FORECASTS (VALUE)
- 5.1 By Offering
- 5.1.1 Hardware
- 5.1.2 Software
- 5.1.3 Services
- 5.2 By Device Form Factor
- 5.2.1 Tethered HMD
- 5.2.2 Stand-Alone HMD
- 5.2.3 Screenless Viewer
- 5.2.4 CAVE / Immersive Rooms
- 5.3 By Immersion Level
- 5.3.1 Non-Immersive
- 5.3.2 Semi-Immersive
- 5.3.3 Fully-Immersive
- 5.4 By End-User Industry
- 5.4.1 Gaming
- 5.4.2 Media and Entertainment
- 5.4.3 Healthcare
- 5.4.4 Education and Training
- 5.4.5 Military and Defense
- 5.4.6 Retail and eCommerce
- 5.4.7 Real Estate and Architecture
- 5.5 By Geography
- 5.5.1 North America
- 5.5.1.1 United States
- 5.5.1.2 Canada
- 5.5.1.3 Mexico
- 5.5.2 South America
- 5.5.2.1 Brazil
- 5.5.2.2 Argentina
- 5.5.2.3 Rest of South America
- 5.5.3 Europe
- 5.5.3.1 Germany
- 5.5.3.2 United Kingdom
- 5.5.3.3 France
- 5.5.3.4 Italy
- 5.5.3.5 Spain
- 5.5.3.6 Russia
- 5.5.3.7 Rest of Europe
- 5.5.4 Asia Pacific
- 5.5.4.1 China
- 5.5.4.2 Japan
- 5.5.4.3 South Korea
- 5.5.4.4 India
- 5.5.4.5 Australia
- 5.5.4.6 New Zealand
- 5.5.4.7 Rest of Asia Pacific
- 5.5.5 Middle East
- 5.5.5.1 United Arab Emirates
- 5.5.5.2 Saudi Arabia
- 5.5.5.3 Turkey
- 5.5.5.4 Rest of Middle East
- 5.5.6 Africa
- 5.5.6.1 South Africa
- 5.5.6.2 Nigeria
- 5.5.6.3 Kenya
- 5.5.6.4 Rest of Africa
- 5.5.1 North America
6 COMPETITIVE LANDSCAPE
- 6.1 Market Concentration
- 6.2 Strategic Moves
- 6.3 Market Share Analysis
- 6.4 Company Profiles (includes Global Level Overview, Market Level Overview, Core Segments, Financials as Available, Strategic Information, Market Rank/Share for Key Companies, Products and Services, Recent Developments)
- 6.4.1 Meta Platforms (Meta Quest)
- 6.4.2 Sony Corporation
- 6.4.3 HTC Corporation
- 6.4.4 Samsung Electronics Co. Ltd
- 6.4.5 Apple Inc.
- 6.4.6 Qualcomm Technologies Inc.
- 6.4.7 Lenovo Group Ltd
- 6.4.8 Pico Interactive Inc.
- 6.4.9 Valve Corporation
- 6.4.10 Varjo Technologies Oy
- 6.4.11 Microsoft Corporation
- 6.4.12 Magic Leap Inc.
- 6.4.13 Vuzix Corporation
- 6.4.14 FOVE Inc.
- 6.4.15 DPVR (Lexiang Tech Co. Ltd)
- 6.4.16 Unity Technologies Inc.
- 6.4.17 Unreal Engine (Epic Games Inc.)
- 6.4.18 Autodesk Inc.
- 6.4.19 Dassault Systemes SE
- 6.4.20 3D Systems Corporation
7 MARKET OPPORTUNITIES AND FUTURE OUTLOOK
- 7.1 White-Space and Unmet-Need Assessment

