PUBLISHER: Mordor Intelligence | PRODUCT CODE: 2120436

PUBLISHER: Mordor Intelligence | PRODUCT CODE: 2120436
Sales Performance Management - Market Share Analysis, Industry Trends & Statistics, Growth Forecasts (2026 - 2031)
According to Mordor Intelligence, the sales performance management market size is expected to grow from USD 2.95 billion in 2025 to USD 3.46 billion in 2026 and is forecast to reach USD 7.61 billion by 2031 at 17.12% CAGR over 2026-2031.
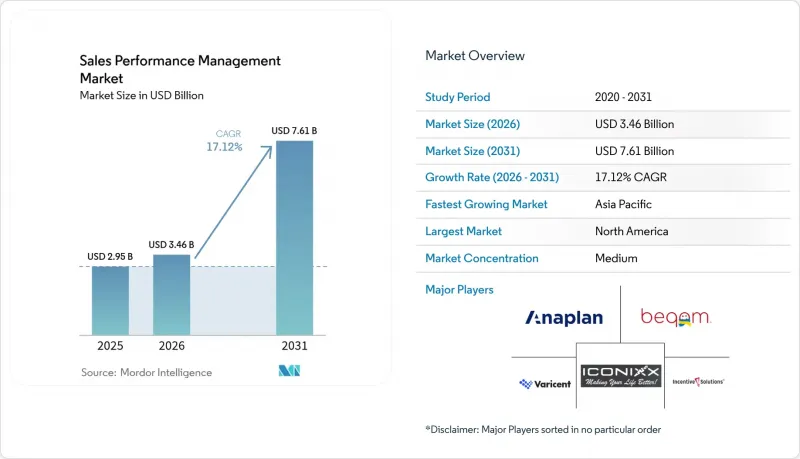
This report is Segmented by Deployment (On-Premise, Cloud), Component (Software, Services), Solution (Incentive Compensation Management, Territory Management, and More), Organization Size (Large Enterprises, Small and Medium Enterprises), End-User Vertical (BFSI, Manufacturing, and More), and Geography (North America, Europe, and More). The Market Forecasts are Provided in Terms of Value (USD).
Global Sales Performance Management Market Trends and Insights
AI-Driven Quota and Territory Optimization
Machine-learning models now rebalance account assignments continuously, replacing annual spreadsheet exercises that frequently miss emerging pockets of demand. Organizations deploying AI-guided territory design have reported up to 7% annual sales lifts after eliminating workload imbalances and white-space overlap. Predictive quota modeling integrates seasonality and individual performance patterns so revenue leaders can adjust goals before pipeline gaps widen. Geolocation data, third-party firmographics, and CRM engagement signals create micro-territories that minimize travel inefficiencies and improve account density. When embedded inside incentive engines, automatic difficulty adjustments maintain rep motivation while keeping payout expense predictable. The capability is particularly valuable for firms managing multi-product lines across expanding regions where manual planning becomes unmanageable.
Cloud-First Upgrades Triggered by Sunset of Legacy ICM Suites
The December 2026 retirement of SAP CallidusCloud obliges thousands of enterprises to re-platform, accelerating cloud adoption beyond organic rates. Buyers confronted with costly on-premises extensions are choosing multi-tenant SPM services that integrate natively with Salesforce, HubSpot, and data-lake architectures. Cloud alternatives reduce custom middleware dependencies and meet audit requirements under ASC 606 with automated documentation, shortening monthly close cycles. Vendors such as Varicent, CaptivateIQ, and Spiff differentiate through rapid migration toolkits and out-of-the-box connectors that compress deployment timelines. For RevOps teams, the shift unlocks elastic scaling and continuous feature updates that on-premises software cannot economically replicate.
Budget Compression from "Efficient-Growth" Mandates
Macroeconomic caution has boards prioritizing capital efficiency, forcing procurement teams to justify SPM spend through hard ROI. Mid-market buyers that once accepted premium per-seat pricing now demand enterprise-grade capability at SMB budgets, elongating sales cycles and escalating discount pressure. CFO involvement means proof-of-value pilots must quantify quota-attainment lifts and administrative cost reductions before contract signature. As scrutiny rises, vendors respond with modular packaging that allows phased rollouts aligned to quarterly budgets, though this fragments revenue and complicates customer success staffing. Consolidation across the RevOps stack intensifies as firms retire point tools in favor of unified suites that drive faster payback.
Other drivers and restraints analyzed in the detailed report include:
- Rise of Usage-Based and Subscription Pricing Models
- Embedded Analytics Inside CRM and RevOps Stacks
- Data-Quality and Integration Hurdles Across Siloed GTM Apps
For complete list of drivers and restraints, kindly check the Table Of Contents.
Segment Analysis
The cloud segment held 70.25% of the Sales Performance Management market in 2025, and it is advancing at a 15.32% CAGR to 2031. Cloud vendors win on API connectivity, elastic scaling, and automatic upgrades that shield users from infrastructure upkeep. On-premises remains relevant in highly regulated environments, yet even those buyers increasingly steer toward hybrid setups that quarantine sensitive data locally while exporting analytics workloads to public clouds. The Sales Performance Management market size for cloud deployments is forecast to almost triple by 2031 as expiring CallidusCloud contracts push laggards to modern SaaS platforms.
Multi-tenant architectures compress per-user costs and democratize advanced capabilities such as AI-assisted territory balancing for mid-market firms. Migration toolkits offering automated data mapping reduce project risk and fuel adoption across North America and Europe first, followed by rapid uptake in Asia-Pacific, where greenfield demand dominates. Vendors that provide sandbox testing and rollback options ease compliance anxiety, accelerating time-to-value for heavily audited sectors like BFSI and healthcare.
Software retained 62.10% revenue share in 2025, yet services revenue is projected to grow 16.55% annually as implementations widen in scope from commission calculation to holistic revenue optimization. High-value engagements cover data migration, plan architecture, and post-go-live administration that many clients lack in-house. Managed offerings supplying continuous rule adjustments, dispute resolution, and audit support are gaining momentum, especially among SMEs that prefer predictable subscription operating expenses. Implementation partners emphasize change-management training to ensure usability and adoption once the system goes live.
The Sales Performance Management market size tied to consulting and managed services is expected to double by 2031, mirroring increasing platform complexity. Vendors invest in partner ecosystems and accelerator templates to shorten project cycles while capturing recurring services revenue. Compliance with GDPR and ASC 606 further boosts demand for advisory help to embed audit trails and automate documentation.
Complete Report Scope:
- By Deployment
- On-premise
- Cloud
- By Component
- Software
- Services
- By Solution
- Incentive Compensation Management
- Territory Management
- Sales Planning and Monitoring
- Sales Analytics
- Other Solutions
- By Organization Size
- Large Enterprises
- Small and Medium Enterprises
- By End-user Vertical
- BFSI
- Manufacturing
- Energy and Utilities
- Healthcare
- IT and Telecom
- Retail and Consumer Goods
- Others (Transportation, Media, etc.)
- By Geography
- North America
- United States
- Canada
- Mexico
- Europe
- United Kingdom
- Germany
- France
- Italy
- Spain
- Russia
- Rest of Europe
- Asia-Pacific
- China
- Japan
- India
- South Korea
- Australia
- Rest of Asia-Pacific
- South America
- Brazil
- Argentina
- Rest of South America
- Middle East and Africa
- Middle East
- Israel
- Saudi Arabia
- United Arab Emirates
- Turkey
- Rest of Middle East
- Africa
- South Africa
- Egypt
- Rest of Africa
- Middle East
- North America
Geography Analysis
North America accounted for 41.10% of 2025 spending, anchored by the United States' technology concentration and advanced RevOps maturity. Adoption growth has slowed as large enterprises complete first-wave migrations, but upgrade cycles add AI and embedded analytics modules to sustain revenue. Canada and Mexico contribute through manufacturing and energy adoptions, while ASC 606 and SOX rules continue to favor automation over spreadsheets.
Asia-Pacific is on pace for an 17.65% CAGR through 2031, making it the fastest-expanding region. China leads with central government digitization programs and expanding multinational seller footprints. India adds momentum through IT-services exports and domestic SaaS insurgents that demand sophisticated commission automation. Southeast Asian markets benefit from smartphone diffusion and cross-border e-commerce, prompting firms to seek real-time seller visibility across multiple currencies and languages.
Europe records steady mid-teens growth as GDPR compliance accelerates cloud SPM uptake that embeds privacy-by-design. The United Kingdom, Germany, and France drive demand via the BFSI and manufacturing sectors that need rigorous audit trails and multi-currency support. Brexit-induced trade complexity elevates the value of platforms offering automated FX and tax calculations. South America and the Middle East and Africa remain nascent but promising, where local enterprises aim to match multinational sales discipline without capital-intensive on-premises investments, gravitating toward subscription cloud offers.
- SAP SE
- Oracle Corporation
- Varicent Inc.
- Xactly Corporation
- NICE Ltd.
- Anaplan Inc.
- Salesforce Inc.
- beqom SA
- Optymyze Inc.
- Performio Solutions Inc.
- CaptivateIQ Inc.
- Everstage Inc.
- Forma.ai Inc.
- Spiff Inc.
- Incentive Solutions Inc.
- Iconixx Software Corporation
- Board International S.A.
- Pigment SAS
- Akeron S.p.A.
- Jedox AG
Additional Benefits:
- The market estimate (ME) sheet in Excel format
- 3 months of analyst support
TABLE OF CONTENTS
1 INTRODUCTION
- 1.1 Study Assumptions and Market Definition
- 1.2 Scope of the Study
2 RESEARCH METHODOLOGY
3 EXECUTIVE SUMMARY
4 MARKET LANDSCAPE
- 4.1 Market Overview
- 4.2 Market Drivers
- 4.2.1 AI-driven quota and territory optimization
- 4.2.2 Cloud-first upgrades triggered by sunset of legacy ICM suites
- 4.2.3 Rise of usage-based and subscription pricing models
- 4.2.4 Embedded analytics inside CRM and RevOps stacks
- 4.2.5 Gamified seller-engagement add-ons for hybrid sales teams
- 4.2.6 Surge in SMB demand for no-code SPM
- 4.3 Market Restraints
- 4.3.1 Budget compression from efficient-growth mandates
- 4.3.2 Data-quality and integration hurdles across siloed GTM apps
- 4.3.3 Shortage of incentive-comp-ops talent
- 4.3.4 Rising compliance overhead (GDPR, SOX, ASC-606)
- 4.4 Value Chain Analysis
- 4.5 Regulatory Landscape
- 4.6 Technological Outlook
- 4.7 Porter's Five Forces Analysis
- 4.7.1 Bargaining Power of Suppliers
- 4.7.2 Bargaining Power of Buyers
- 4.7.3 Threat of New Entrants
- 4.7.4 Intensity of Competitive Rivalry
- 4.7.5 Threat of Substitutes
5 MARKET SIZE AND GROWTH FORECASTS (VALUE)
- 5.1 By Deployment
- 5.1.1 On-premise
- 5.1.2 Cloud
- 5.2 By Component
- 5.2.1 Software
- 5.2.2 Services
- 5.3 By Solution
- 5.3.1 Incentive Compensation Management
- 5.3.2 Territory Management
- 5.3.3 Sales Planning and Monitoring
- 5.3.4 Sales Analytics
- 5.3.5 Other Solutions
- 5.4 By Organization Size
- 5.4.1 Large Enterprises
- 5.4.2 Small and Medium Enterprises
- 5.5 By End-user Vertical
- 5.5.1 BFSI
- 5.5.2 Manufacturing
- 5.5.3 Energy and Utilities
- 5.5.4 Healthcare
- 5.5.5 IT and Telecom
- 5.5.6 Retail and Consumer Goods
- 5.5.7 Others (Transportation, Media, etc.)
- 5.6 By Geography
- 5.6.1 North America
- 5.6.1.1 United States
- 5.6.1.2 Canada
- 5.6.1.3 Mexico
- 5.6.2 Europe
- 5.6.2.1 United Kingdom
- 5.6.2.2 Germany
- 5.6.2.3 France
- 5.6.2.4 Italy
- 5.6.2.5 Spain
- 5.6.2.6 Russia
- 5.6.2.7 Rest of Europe
- 5.6.3 Asia-Pacific
- 5.6.3.1 China
- 5.6.3.2 Japan
- 5.6.3.3 India
- 5.6.3.4 South Korea
- 5.6.3.5 Australia
- 5.6.3.6 Rest of Asia-Pacific
- 5.6.4 South America
- 5.6.4.1 Brazil
- 5.6.4.2 Argentina
- 5.6.4.3 Rest of South America
- 5.6.5 Middle East and Africa
- 5.6.5.1 Middle East
- 5.6.5.1.1 Israel
- 5.6.5.1.2 Saudi Arabia
- 5.6.5.1.3 United Arab Emirates
- 5.6.5.1.4 Turkey
- 5.6.5.1.5 Rest of Middle East
- 5.6.5.2 Africa
- 5.6.5.2.1 South Africa
- 5.6.5.2.2 Egypt
- 5.6.5.2.3 Rest of Africa
- 5.6.5.1 Middle East
- 5.6.1 North America
6 COMPETITIVE LANDSCAPE
- 6.1 Market Concentration
- 6.2 Strategic Moves
- 6.3 Market Share Analysis
- 6.4 Company Profiles (includes Global-level Overview, Market-level Overview, Core Segments, Financials as available, Strategic Information, Market Rank/Share, Products and Services, and Recent Developments)
- 6.4.1 SAP SE
- 6.4.2 Oracle Corporation
- 6.4.3 Varicent Inc.
- 6.4.4 Xactly Corporation
- 6.4.5 NICE Ltd.
- 6.4.6 Anaplan Inc.
- 6.4.7 Salesforce Inc.
- 6.4.8 beqom SA
- 6.4.9 Optymyze Inc.
- 6.4.10 Performio Solutions Inc.
- 6.4.11 CaptivateIQ Inc.
- 6.4.12 Everstage Inc.
- 6.4.13 Forma.ai Inc.
- 6.4.14 Spiff Inc.
- 6.4.15 Incentive Solutions Inc.
- 6.4.16 Iconixx Software Corporation
- 6.4.17 Board International S.A.
- 6.4.18 Pigment SAS
- 6.4.19 Akeron S.p.A.
- 6.4.20 Jedox AG
7 MARKET OPPORTUNITIES AND FUTURE OUTLOOK
- 7.1 White-space and Unmet-need Assessment

