PUBLISHER: Mordor Intelligence | PRODUCT CODE: 2120760

PUBLISHER: Mordor Intelligence | PRODUCT CODE: 2120760
Mobile Analytics - Market Share Analysis, Industry Trends & Statistics, Growth Forecasts (2026 - 2031)
According to Mordor Intelligence, the mobile analytics market size was valued at USD 9.05 billion in 2025 and estimated to grow from USD 11.19 billion in 2026 to reach USD 32.33 billion by 2031, at a CAGR of 23.65% during the forecast period (2026-2031).
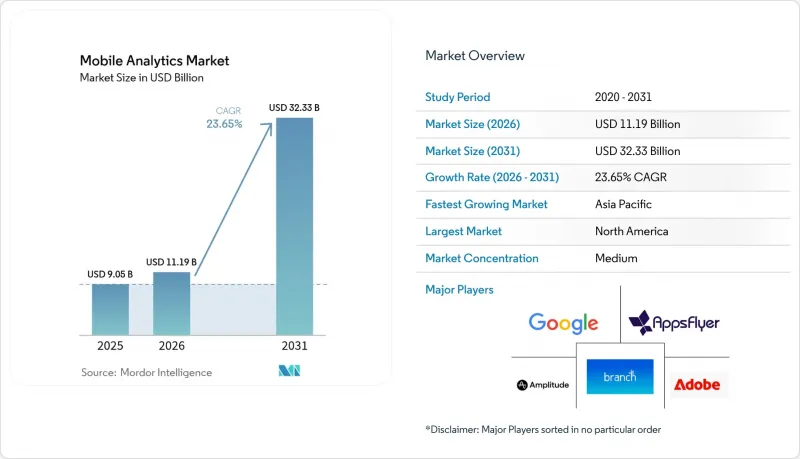
This report is Segmented by Component (Software, Services), Analytics Type (Application-Analytics, Campaign-Analytics, Service-Analytics, In-App Behavioral Analytics), Deployment Mode (Cloud, On-Premise), Organisation Size (Large Enterprises, Small and Medium Enterprises), End-User Vertical (BFSI, Media and Entertainment, and More), and Geography. The Market Forecasts are Provided in Terms of Value (USD).
Global Mobile Analytics Market Trends and Insights
Smartphone proliferation generates exabytes of behavioral data.
Global smartphone users reached 6.8 billion in 2024, each device emitting roughly 2.5 GB of behavioral signals per month. Continuous streams of taps, scrolls, and location pings give enterprises fine-grained views of customer journeys, and 5G bandwidth makes real-time inference feasible. Retail apps now mine micro-gestures such as scroll velocity to predict purchase intent with up to 89% accuracy. Processing at device edge is gaining ground to reduce latency and safeguard privacy, prompting vendors to ship lightweight SDKs capable of local computation. These SDKs shrink data transfer volumes and meet tightening privacy mandates while keeping performance intact, cementing edge analytics as a key value driver for the mobile analytics market.
Explosive growth of mobile-commerce transactions
Mobile commerce generated 58.9% of global e-commerce value in 2024, placing heavy emphasis on real-time journey tracking within apps. China alone processed USD 49.2 trillion in mobile payments in 2024, fueling demand for fraud detection and multi-touch attribution. Social commerce and live-stream shopping create complex, rapid funnels that standard web tools cannot map. Vendors respond with specialized modules that stitch together purchase pathways across chat, video, and in-app stores within seconds, reinforcing the strategic relevance of the mobile analytics market to omnichannel growth agendas.
Stringent data-privacy regulations such as GDPR and CCPA
Enterprises allocate about USD 1.3 million per year to keep mobile analytics stacks GDPR-ready. California's CCPA extends similar duties to large U.S. markets, while Brazil and India draft parallel laws. Vendors embed differential privacy and federated learning so models run on decentralized data, minimizing raw collection. Google's Privacy Sandbox for Android exemplifies this pivot, replacing cross-app identifiers with aggregated signals. Compliance lifts barriers to entry and trims the attainable growth curve for the mobile analytics market, even as it differentiates platforms that master privacy-by-design engineering.
Other drivers and restraints analyzed in the detailed report include:
- Rapid enterprise shift to cloud-native analytics platforms
- Rising mobile advertising budgets are driving demand for in-app insights.
- Apple's App Tracking Transparency limits attribution data.
For complete list of drivers and restraints, kindly check the Table Of Contents.
Segment Analysis
Software products contributed 68.62% of 2025 revenue, underscoring their role as the default entry point for most buyers in the mobile analytics market. Many enterprises favor visual, self-service dashboards that plug into existing data lakes and marketing clouds without extensive coding. Yet rising regulatory complexity and SDK integration pain points elevate consulting and managed services, propelling the segment at 25.4% CAGR to 2031. Implementation partners help migrate legacy tracking setups, deploy privacy-preserving models, and tune real-time personalization engines, workstreams that internal teams often lack bandwidth for. For heavily regulated sectors such as banking, external experts design GDPR-compliant funnels that retain predictive strength while lowering data collection footprints.
Managed services address skill shortages for SMEs by bundling maintenance, data engineering, and experimentation support under subscription. As a result, services revenue captures an expanding slice of the mobile analytics market, even though core software still anchors budget line items. Vendors differentiate via industry playbooks-for instance, healthcare templates that expedite HIPAA alignment. The trend suggests a future where outcome-based service contracts accompany platform licenses, reinforcing mixed-revenue models across the mobile analytics market.
Application-analytics held a 34.98% share in 2025, thanks to its focus on acquisition, retention, and conversion metrics familiar to digital teams. Campaign analytics and service analytics follow, supporting ad attribution and customer support optimization. However, in-app behavioral analytics is scaling fastest at 24.1% CAGR as enterprises recognize that surface metrics miss crucial intent cues. Streaming services detect abandonment within 30 seconds of playback and push alternate content to improve engagement by 23%. Gaming studios read finger-pressure patterns to tune difficulty curves in real time, anchoring monetization.
Machine learning models have matured to interpret micro-gestures, context switching, and session cadence with high reliability. Consequently, behavioral analytics graduates move from mere diagnostics to predictive orchestration, positioning it as a cornerstone of value creation in the mobile analytics market. As adoption widens, the boundary blurs between behavioral analytics and AI-driven personalization, prompting vendors to bake inference engines directly into SDKs for latency-free decisioning.
Complete Report Scope:
- By Component
- Software
- Services
- By Analytics Type
- Application-Analytics
- Campaign-Analytics
- Service-Analytics
- In-App Behavioral Analytics
- By Deployment Mode
- Cloud
- On-Premise
- By Organisation Size
- Large Enterprises
- Small and Medium Enterprises (SMEs)
- By End-User Vertical
- Retail and E-commerce
- Banking, Financial Services and Insurance (BFSI)
- Government and Public Sector
- Information Technology and Telecommunications
- Media and Entertainment
- Travel and Hospitality
- Healthcare and Life-Sciences
- By Geography
- North America
- United States
- Canada
- Mexico
- Europe
- Germany
- United Kingdom
- France
- Russia
- Rest of Europe
- Asia-Pacific
- China
- Japan
- India
- South Korea
- Australia
- Rest of Asia-Pacific
- Middle East and Africa
- Middle East
- Saudi Arabia
- United Arab Emirates
- Rest of Middle East
- Africa
- South Africa
- Egypt
- Rest of Africa
- Middle East
- South America
- Brazil
- Argentina
- Rest of South America
- North America
Geography Analysis
North America produced 38.25% of 2025 revenue owing to entrenched digital ad ecosystems, high mobile spend per capita, and robust venture funding. U.S. lawmakers shaped the regulatory agenda through CCPA, which spurred nationwide adoption of privacy-by-design data architectures. Canada shows momentum in fintech analytics, while Mexico's expanding e-commerce base creates new white space for vendors that localize Spanish-language dashboards. The region's deep technical workforce accelerates experimentation with edge AI, reinforcing its leadership in the mobile analytics market.
Asia-Pacific registers the fastest expansion at 24.05% CAGR through 2031. Penetration surpasses 85% in China, India, and Southeast Asia, and government schemes such as Digital India promote mobile-first citizen services. China's social-commerce giants capture streams of voice, video, and chat that require petabyte-scale analytics, while India's UPI framework fuels payment data growth. Japan and South Korea leverage 5G to power low-latency gaming insights, and Australia emphasizes CX optimization for banking and travel apps. Fragmented data-protection rules create integration hurdles, yet cross-border providers that secure localized hosting win share, highlighting Asia-Pacific as the prime acceleration engine in the mobile analytics market.
Europe grows steadily under tight GDPR oversight, favoring vendors with advanced consent orchestration. Germany pioneers industrial IoT analytics embedded in connected-car apps, the U.K. capitalizes on open banking trends, and France innovates in media streaming intelligence. Russia enforces compulsory data localization, isolating its ecosystem and opening room for domestic players. Despite a slower regional CAGR, Europe's policy influence steers global roadmaps, making compliance features developed for EU clients standard elsewhere within the mobile analytics market.
- Adobe Inc.
- Alphabet Inc. (Google LLC)
- Amplitude, Inc.
- AppsFlyer Ltd.
- Branch Metrics, Inc.
- CleverTap Pvt. Ltd.
- Contentsquare SAS
- Data.ai Inc. (App Annie)
- Heap Inc.
- International Business Machines Corporation (IBM)
- Localytics (Upland Software, Inc.)
- Meta Platforms, Inc.
- Microsoft Corporation
- Mixpanel, Inc.
- MoEngage, Inc.
- Oracle Corporation
- OXFORD University Press (Adjust GmbH) - Adjust
- Piwik PRO Sp. z o.o.
- Salesforce, Inc. (Tableau Mobile)
- Snowplow Analytics Ltd.
Additional Benefits:
- The market estimate (ME) sheet in Excel format
- 3 months of analyst support
TABLE OF CONTENTS
1 INTRODUCTION
- 1.1 Study Assumptions and Market Definition
- 1.2 Scope of the Study
2 RESEARCH METHODOLOGY
3 EXECUTIVE SUMMARY
4 MARKET LANDSCAPE
- 4.1 Market Overview
- 4.2 Market Drivers
- 4.2.1 Smart-phone proliferation generates exabytes of behavioral data
- 4.2.2 Explosive growth of mobile-commerce transactions
- 4.2.3 Rapid enterprise shift to cloud-native analytics platforms
- 4.2.4 Rising mobile advertising budgets driving demand for in-app insights
- 4.2.5 AI-powered predictive analytics enabling hyper-personalization
- 4.2.6 On-device, privacy-preserving analytics frameworks gain traction
- 4.3 Market Restraints
- 4.3.1 Stringent data-privacy regulations such as GDPR and CCPA
- 4.3.2 High risk of mobile data security breaches
- 4.3.3 Apple's App Tracking Transparency limits attribution data
- 4.3.4 SDK fragmentation causing app-performance overhead
- 4.4 Industry Value / Supply-Chain Analysis
- 4.5 Regulatory Landscape and Standards
- 4.6 Technological Outlook (Edge and AI analytics)
- 4.7 Porter's Five Forces Analysis
- 4.7.1 Bargaining Power of Suppliers
- 4.7.2 Bargaining Power of Buyers
- 4.7.3 Threat of New Entrants
- 4.7.4 Threat of Substitutes
- 4.7.5 Intensity of Competitive Rivalry
5 MARKET SIZE AND GROWTH FORECASTS (VALUE)
- 5.1 By Component
- 5.1.1 Software
- 5.1.2 Services
- 5.2 By Analytics Type
- 5.2.1 Application-Analytics
- 5.2.2 Campaign-Analytics
- 5.2.3 Service-Analytics
- 5.2.4 In-App Behavioral Analytics
- 5.3 By Deployment Mode
- 5.3.1 Cloud
- 5.3.2 On-Premise
- 5.4 By Organisation Size
- 5.4.1 Large Enterprises
- 5.4.2 Small and Medium Enterprises (SMEs)
- 5.5 By End-User Vertical
- 5.5.1 Retail and E-commerce
- 5.5.2 Banking, Financial Services and Insurance (BFSI)
- 5.5.3 Government and Public Sector
- 5.5.4 Information Technology and Telecommunications
- 5.5.5 Media and Entertainment
- 5.5.6 Travel and Hospitality
- 5.5.7 Healthcare and Life-Sciences
- 5.6 By Geography
- 5.6.1 North America
- 5.6.1.1 United States
- 5.6.1.2 Canada
- 5.6.1.3 Mexico
- 5.6.2 Europe
- 5.6.2.1 Germany
- 5.6.2.2 United Kingdom
- 5.6.2.3 France
- 5.6.2.4 Russia
- 5.6.2.5 Rest of Europe
- 5.6.3 Asia-Pacific
- 5.6.3.1 China
- 5.6.3.2 Japan
- 5.6.3.3 India
- 5.6.3.4 South Korea
- 5.6.3.5 Australia
- 5.6.3.6 Rest of Asia-Pacific
- 5.6.4 Middle East and Africa
- 5.6.4.1 Middle East
- 5.6.4.1.1 Saudi Arabia
- 5.6.4.1.2 United Arab Emirates
- 5.6.4.1.3 Rest of Middle East
- 5.6.4.2 Africa
- 5.6.4.2.1 South Africa
- 5.6.4.2.2 Egypt
- 5.6.4.2.3 Rest of Africa
- 5.6.4.1 Middle East
- 5.6.5 South America
- 5.6.5.1 Brazil
- 5.6.5.2 Argentina
- 5.6.5.3 Rest of South America
- 5.6.1 North America
6 COMPETITIVE LANDSCAPE
- 6.1 Market Concentration
- 6.2 Strategic Moves (M&A, Funding, Partnerships)
- 6.3 Market Share Analysis
- 6.4 Company Profiles (includes Global level Overview, Market level overview, Core Segments, Financials as available, Strategic Information, Market Rank/Share, Products and Services, Recent Developments)
- 6.4.1 Adobe Inc.
- 6.4.2 Alphabet Inc. (Google LLC)
- 6.4.3 Amplitude, Inc.
- 6.4.4 AppsFlyer Ltd.
- 6.4.5 Branch Metrics, Inc.
- 6.4.6 CleverTap Pvt. Ltd.
- 6.4.7 Contentsquare SAS
- 6.4.8 Data.ai Inc. (App Annie)
- 6.4.9 Heap Inc.
- 6.4.10 International Business Machines Corporation (IBM)
- 6.4.11 Localytics (Upland Software, Inc.)
- 6.4.12 Meta Platforms, Inc.
- 6.4.13 Microsoft Corporation
- 6.4.14 Mixpanel, Inc.
- 6.4.15 MoEngage, Inc.
- 6.4.16 Oracle Corporation
- 6.4.17 OXFORD University Press (Adjust GmbH) - Adjust
- 6.4.18 Piwik PRO Sp. z o.o.
- 6.4.19 Salesforce, Inc. (Tableau Mobile)
- 6.4.20 Snowplow Analytics Ltd.
7 MARKET OPPORTUNITIES AND FUTURE OUTLOOK
- 7.1 White-Space and Unmet-Need Assessment

