PUBLISHER: Mordor Intelligence | PRODUCT CODE: 2120786

PUBLISHER: Mordor Intelligence | PRODUCT CODE: 2120786
Carbon Nanotubes - Market Share Analysis, Industry Trends & Statistics, Growth Forecasts (2026 - 2031)
According to Mordor Intelligence, the carbon nanotubes market size is expected to grow from USD 5.72 billion in 2025 to USD 6.93 billion in 2026 and is forecast to reach USD 18.07 billion by 2031 at 21.13% CAGR over 2026-2031.
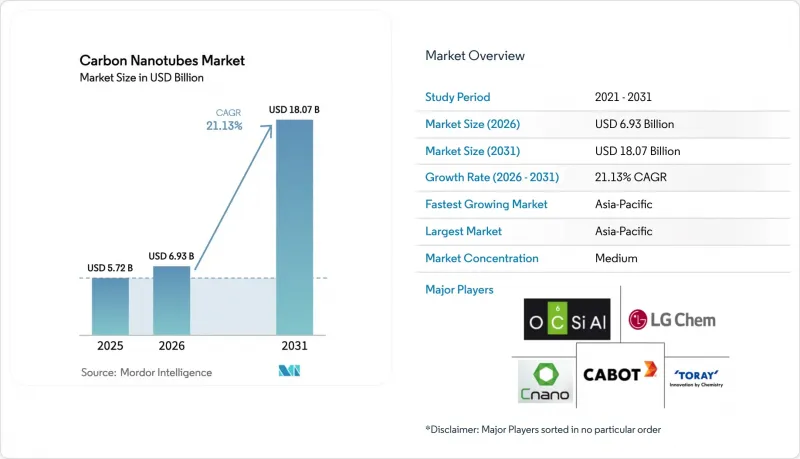
This report is Segmented by Type (Multi-Walled, Single-Walled, and More), Manufacturing Method (Chemical Vapor Deposition (CVD), High-Pressure Carbon Monoxide (HiPco), and More), End-Use Industry (Electrical and Electronics, Energy, Automotive, and More), and Geography (Asia-Pacific, North America, Europe, and More). Market Forecasts are Provided in Terms of Value (USD) and Volume (Tons).
Global Carbon Nanotubes Market Trends and Insights
E-mobility Boom Accelerating CNT Demand
Electric-vehicle battery packs now incorporate 0.5-2.0 wt% CNTs to maintain electron pathways across silicon-graphite anodes that swell during cycling. LG Chem's four South Korean plants deliver 6,100 tons/year output under multi-year contracts with Tier-1 automakers, locking in supply for global platform launches. China's New Energy Vehicle plan sets a 50,000 tons/year CNT requirement by 2025, already matched by Jiangsu Cnano's 12,000 tons/year single-site capacity. The migration toward lithium-iron-phosphate chemistries intensifies demand because LFP cells need higher conductive-additive loadings. Solid-state prototypes from QuantumScape and Samsung SDI embed nanotube current collectors, positioning CNTs as a bridging solution through the 2030s.
Leap in High-Energy-Density Li-ion and Supercapacitor Production
Vertically aligned CNT forests deliver surface areas above 1,000 m2/g that drive supercapacitor power densities of 10-15 kW/kg. Resonac Holdings supplies dispersions for 48-V mild-hybrid modules that buffer load spikes and extend pack life. Laboratory CNT-sulfur cathodes have reached 400 Wh/kg, though commercial timelines depend on polysulfide mitigation. Kumho Petrochemical operates a 1,200-ton/year plant delivering ultra-pure grades with <100 ppm metals for supercapacitors. Grid projects in California and Germany pilot CNT-supercapacitor banks that could absorb 5,000 tons/year by 2030 once costs fall below USD 200/kWh.
Occupational Toxicology and Nano-Regulation Tightening in EU and US
The European Chemicals Agency listed multi-walled CNTs as substances of very great concern under REACH Annex XIV in 2024, triggering costly authorization filings for users above 1 ton/year. NIOSH set a 1 µg/m3 exposure limit that forces enclosed handling and real-time aerosol monitoring, adding USD 2-5 million in capex for mid-scale plants. Long CNT fibers longer than 15 µm show asbestos-like inflammation in rodent lungs, though human epidemiology remains limited. Smaller European firms see compliance costs topping 15% of revenue, accelerating consolidation. ISO 80004 terminology harmonization helps, but divergent national rollouts still hamper cross-border supply chains. Producers invest in surface treatments that shorten aspect ratios below 10:1, a strategy that early in vitro assays suggest lowers cytotoxicity.
Other drivers and restraints analyzed in the detailed report include:
- Aerospace Push for Ultra-Light Structural Composites
- Additive Manufacturing Integration for Conductive Filaments
- Competition from Graphene and Boron-Nitride Nanotubes in Thermal Apps
For complete list of drivers and restraints, kindly check the Table Of Contents.
Segment Analysis
Multi-walled CNTs commanded 90.03% of carbon nanotubes market share in 2025 and are forecast to advance at a 20.67% CAGR through 2031. Pricing between USD 50-300/kg secures traction in battery, composite, and plastics lines where cost sensitivity overrides ultimate conductivity. Single-walled grades' USD 1,500-2,000/kg prices confine them to semiconductor and quantum-computing uses that prize purity and narrow diameter spread. Emerging few-walled variants from OCSiAl preserve 70% of SWCNT conductivity at 40% of the cost, enticing battery makers aiming to slash additive loadings without sacrificing performance. Armchair SWCNTs target OLED conductive films once sheet resistance falls below 100 Ω/sq, a milestone expected within three years.
Supply scalability favors multi-walled feedstock because CVD mega-plants deliver volumes unattainable with HiPco or laser ablation. The carbon nanotubes market size for multi-walled products is projected to exceed USD 13 billion by 2031 under base-case demand scenarios. Regulatory clearance is smoother as larger diameters reduce fiber biopersistence. Yet premium single-walled lines keep margins high through IP-protected purification, commanding 30-40% EBIT. Producers that straddle both tiers hedge revenue streams, capturing high-volume commodity sales while cultivating specialty niches in photonics and quantum devices.
Complete Report Scope:
- By Type
- Multi-Walled Carbon Nanotubes (MWCNT)
- Single-Walled Carbon Nanotubes (SWCNT)
- Other Types (Armchair, Zigzag, Double-Walled)
- By Manufacturing Method
- Chemical Vapor Deposition (CVD)
- High-Pressure Carbon Monoxide (HiPco)
- Arc Discharge
- Laser Ablation
- By End-Use Industry
- Electrical and Electronics
- Energy
- Automotive
- Aerospace and Defense
- Healthcare
- Other Industries (Textiles, Construction, Plastics and Composites)
- By Geography
- Asia-Pacific
- China
- India
- Japan
- South Korea
- Rest of Asia-Pacific
- North America
- United States
- Canada
- Mexico
- Europe
- Germany
- United Kingdom
- Italy
- France
- Spain
- Rest of Europe
- South America
- Brazil
- Argentina
- Rest of South America
- Middle East and Africa
- Saudi Arabia
- South Africa
- Rest of Middle East and Africa
- Asia-Pacific
Geography Analysis
Asia-Pacific dominated with 54.45% of the 2025 volume and is forecast to rise at a 21.67% CAGR during 2026-2031. China's 12,000-ton/year Jiangsu Cnano complex and South Korea's 6,100 tons/year LG Chem network anchor regional supply pipelines to CATL, BYD, Samsung SDI, and SK Innovation. Japan prioritizes high-purity lines for aerospace and semiconductors, leveraging Toray's ¥5 billion prepreg expansion. India relies on imports today, but incentives under its PLI scheme could spark domestic CVD projects by 2028. Regional pricing sits at USD 50-80/kg for multi-walled grades due to integration into petrochemical feedstocks and scale economies.
North America's market growth is influenced by domestic sourcing from the aerospace, defense, and energy storage industries. Inflation Reduction Act tax credits support potential 2,000-ton/year new capacity colocated with battery gigafactories. Canada's Raymor markets low-carbon plasma-torch CNTs powered by hydropower, while Mexico offers dispersion and compounding services for automotive suppliers.
Europe's captured CNT demand is bolstered by the European Battery Alliance's drive for local conductive additives. Nanocyl and Arkema operate mid-scale plants serving Airbus and Stellantis platforms, yet REACH compliance adds cost layers that pressure smaller entrants. Thomas Swan's U.K. lines secure defense demand where ITAR rules deter Asian imports. South America and the Middle East-Africa are witnessing gradual market growth, with Brazil importing CNTs for agrochemicals and Saudi Arabia studying petrochemical integration as part of Vision 2030.
- Applied Nanostructures, Inc.
- Arkema
- Cabot Corporation
- Carbon Solutions, Inc.
- CHASM
- Cheap Tubes
- Chengdu Organic Chemicals Co., Ltd.
- CNT Co., Ltd.
- FutureCarbon GmbH
- Hanwha Group
- Hyperion Catalysis International
- Jiangsu Cnano Technology Co., Ltd.
- Kumho Petrochemical
- LG Chem
- Meijo Nano Carbon Co.,Ltd
- Nano-C
- Nanocyl SA
- OCSiAl
- Raymor Industries Inc.
- Resonac Holdings Corporation
- Thomas Swan & Co., Ltd.
- Toray Industries, Inc.
- Zyvex Technologies
Additional Benefits:
- The market estimate (ME) sheet in Excel format
- 3 months of analyst support
TABLE OF CONTENTS
1 Introduction
- 1.1 Study Assumptions and Market Definition
- 1.2 Scope of the Study
2 Research Methodology
3 Executive Summary
4 Market Landscape
- 4.1 Market Overview
- 4.2 Market Drivers
- 4.2.1 E-mobility Boom Accelerating CNT Demand
- 4.2.2 Leap in High-Energy-Density Li-ion and Supercapacitor Production
- 4.2.3 Aerospace Push for Ultra-light Structural Composites
- 4.2.4 Desalination and Environmental Sensors Adoption in MEA and Asia
- 4.2.5 Additive Manufacturing Integration for Conductive Filaments
- 4.3 Market Restraints
- 4.3.1 Occupational Toxicology and Nano-regulation in Europe and United States
- 4.3.2 Competition from Graphene and Boron-Nitride Nanotubes in Thermal Apps
- 4.3.3 Patent Thickets Concentrating Licensing Costs
- 4.4 Value Chain Analysis
- 4.5 Porter's Five Forces Analysis
- 4.5.1 Bargaining Power of Suppliers
- 4.5.2 Bargaining Power of Buyers
- 4.5.3 Threat of New Entrants
- 4.5.4 Threat of Substitutes
- 4.5.5 Degree of Competition
- 4.6 Patent Analysis
5 Market Size and Growth Forecasts (Value and Volume)
- 5.1 By Type
- 5.1.1 Multi-Walled Carbon Nanotubes (MWCNT)
- 5.1.2 Single-Walled Carbon Nanotubes (SWCNT)
- 5.1.3 Other Types (Armchair, Zigzag, Double-Walled)
- 5.2 By Manufacturing Method
- 5.2.1 Chemical Vapor Deposition (CVD)
- 5.2.2 High-Pressure Carbon Monoxide (HiPco)
- 5.2.3 Arc Discharge
- 5.2.4 Laser Ablation
- 5.3 By End-Use Industry
- 5.3.1 Electrical and Electronics
- 5.3.2 Energy
- 5.3.3 Automotive
- 5.3.4 Aerospace and Defense
- 5.3.5 Healthcare
- 5.3.6 Other Industries (Textiles, Construction, Plastics and Composites)
- 5.4 By Geography
- 5.4.1 Asia-Pacific
- 5.4.1.1 China
- 5.4.1.2 India
- 5.4.1.3 Japan
- 5.4.1.4 South Korea
- 5.4.1.5 Rest of Asia-Pacific
- 5.4.2 North America
- 5.4.2.1 United States
- 5.4.2.2 Canada
- 5.4.2.3 Mexico
- 5.4.3 Europe
- 5.4.3.1 Germany
- 5.4.3.2 United Kingdom
- 5.4.3.3 Italy
- 5.4.3.4 France
- 5.4.3.5 Spain
- 5.4.3.6 Rest of Europe
- 5.4.4 South America
- 5.4.4.1 Brazil
- 5.4.4.2 Argentina
- 5.4.4.3 Rest of South America
- 5.4.5 Middle East and Africa
- 5.4.5.1 Saudi Arabia
- 5.4.5.2 South Africa
- 5.4.5.3 Rest of Middle East and Africa
- 5.4.1 Asia-Pacific
6 Competitive Landscape
- 6.1 Market Concentration
- 6.2 Strategic Moves
- 6.3 Market Share Analysis
- 6.4 Company Profiles (includes Global level Overview, Market level overview, Core Segments, Financials as available, Strategic Information, Products and Services, Recent Developments)
- 6.4.1 Applied Nanostructures, Inc.
- 6.4.2 Arkema
- 6.4.3 Cabot Corporation
- 6.4.4 Carbon Solutions, Inc.
- 6.4.5 CHASM
- 6.4.6 Cheap Tubes
- 6.4.7 Chengdu Organic Chemicals Co., Ltd.
- 6.4.8 CNT Co., Ltd.
- 6.4.9 FutureCarbon GmbH
- 6.4.10 Hanwha Group
- 6.4.11 Hyperion Catalysis International
- 6.4.12 Jiangsu Cnano Technology Co., Ltd.
- 6.4.13 Kumho Petrochemical
- 6.4.14 LG Chem
- 6.4.15 Meijo Nano Carbon Co.,Ltd
- 6.4.16 Nano-C
- 6.4.17 Nanocyl SA
- 6.4.18 OCSiAl
- 6.4.19 Raymor Industries Inc.
- 6.4.20 Resonac Holdings Corporation
- 6.4.21 Thomas Swan & Co., Ltd.
- 6.4.22 Toray Industries, Inc.
- 6.4.23 Zyvex Technologies
7 Market Opportunities and Future Outlook
- 7.1 White-Space and Unmet-Need Assessment
- 7.2 Increasing Demand for Energy Storage Devices

