PUBLISHER: Mordor Intelligence | PRODUCT CODE: 2121237

PUBLISHER: Mordor Intelligence | PRODUCT CODE: 2121237
Wireless Healthcare Asset Management - Market Share Analysis, Industry Trends & Statistics, Growth Forecasts (2026 - 2031)
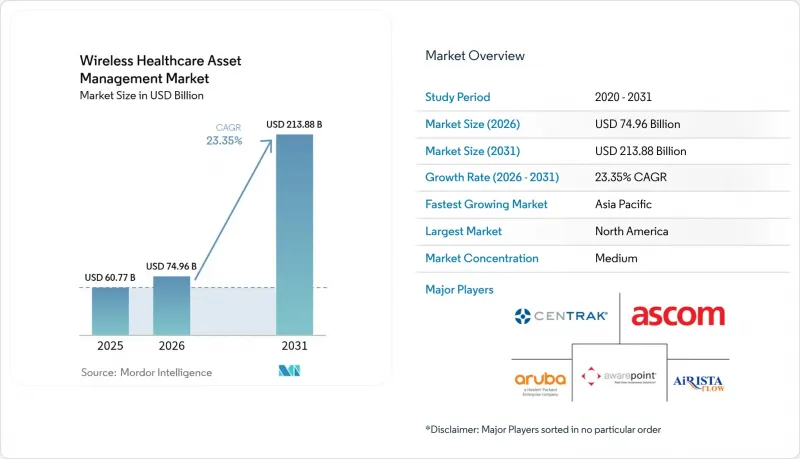
According to Mordor Intelligence, the wireless healthcare asset management market size is expected to grow from USD 60.77 billion in 2025 to USD 74.96 billion in 2026 and is forecast to reach USD 213.88 billion by 2031 at 23.35% CAGR over 2026-2031.
This report is Segmented by Product (Asset Tags, Wearable Tags, Wireless Sensors, and More), Technology (RFID, Wi-Fi, and More), Application (Asset and Inventory Tracking, Patient and Staff Safety, and More), End User (Hospitals and Integrated Delivery Networks, Ambulatory Surgery Centers, and More), and Geography. The Market Forecasts are Provided in Terms of Value (USD).
Global Wireless Healthcare Asset Management Market Trends and Insights
Rapid Adoption of RFID-Based Asset Tagging
Hospitals are embedding passive RFID tags into infusion pumps, ventilators, and wheelchairs because the technology provides read ranges of 3 m-10 m without requiring batteries, a critical benefit in settings where biomedical staff turnover exceeds 20% annually. Impinj's M800 reader, launched in 2024, improves tag-read density by 40%, allowing one fixed reader to monitor 200 assets in busy corridors. FDA guidance issued the same year confirmed that RFID labels attached to Class II devices need no separate 510(k) filing, removing a key regulatory hurdle. A peer-reviewed study demonstrated that RFID tracking reduced search time by 68% in a 300-bed hospital and enabled 4.2 additional monthly procedures per operating room. Ambulatory surgery centers, where manual audits consume up to 90 minutes per shift, are consequently accelerating rollouts.
Need for Real-Time Asset Visibility to Cut Equipment Search Time
Clinical teams in U.S. hospitals lose 21 minutes per shift searching for devices, a drain exacerbated by value-based payment models that penalize extended lengths of stay. Real-time location systems, which refresh every 5-10 seconds, route the nearest available pump or ECG unit to the requesting ward, reducing response time from 12 minutes to under 3 minutes. A 2024 integrated delivery network saved USD 1.8 million a year on rentals after achieving 95% visibility via Wi-Fi triangulation. Zebra Technologies reports customers trimmed capital expenditure by 18% by redeploying idle assets surfaced through its MotionWorks analytics.
High Upfront Hardware and Integration Costs
A 300-bed deployment typically requires 150-200 infrastructure nodes, along with 3,000 tags, resulting in a capital outlay of USD 400,000-600,000 before accounting for software and labor costs. Ambulatory surgery centers operating on 3%-5% margins struggle to fund such investments despite 24-month payback models. Linking platforms to EHRs like Epic can add 6-9 months of custom interface work priced at USD 150-250 per hour. RTLS-as-a-Service, where vendors retain hardware ownership and bill monthly per-tag fees, is easing friction but remains nascent outside North America.
Other drivers and restraints analyzed in the detailed report include:
- Rising Investment in Smart Hospital Infrastructure
- Edge-AI Predictive Maintenance Reducing Device Downtime
- Data-Privacy and Cybersecurity Compliance Hurdles
For complete list of drivers and restraints, kindly check the Table Of Contents.
Segment Analysis
Software Platforms are expanding at a rate of 25.95% annually, outpacing the overall wireless healthcare asset management market. Hospitals recognize that raw location data has limited value without predictive analytics, EHR integration, and automated audit trails. Asset Tags retained a 42.65% share in 2025, reflecting a legacy RFID and BLE installed base, yet revenue is migrating to recurring software fees. Wearable Tags for duress and elopement prevention are gaining steam in behavioral health units. Wireless Sensor monitoring of temperature and humidity surged following the updated USP 797 sterility rules. Hardware margins are being compressed as semiconductor firms integrate UWB into general-purpose Wi-Fi chipsets, underscoring the shift toward platform economics.
Software-centric vendors tend to capture higher valuation multiples; Zebra's 2024 filing showed that software and services rose 31% year-over-year, compared to 12% for hardware. As a result, the wireless healthcare asset management market is tilting toward end-to-end subscriptions that roll infrastructure, tags, analytics, and compliance reporting into predictable OPEX.
RFID held a 55.10% share in 2025, thanks to the adoption of battery-free passive tags and the increasing ubiquity of readers. However, UWB is growing 26.05% a year as surgical theaters, catheter labs, and neonatal ICUs demand <30 cm accuracy, unattainable with Wi-Fi triangulation or BLE beacons. Wi-Fi solutions leverage existing access points but deliver errors of 3 m-5 m in metal-dense environments. BLE balances cost and performance, making it the preferred option for long-term care facilities. ZigBee and infrared remain niche. Qorvo shipped 12 million UWB chips in 2024, a 47% increase, driven by the demand for surgical instrument tracking.
Hospitals now operate dual-tier architectures, utilizing RFID or BLE for wheelchairs and pumps, and UWB for high-value instruments. Vendors that can orchestrate both layers within a single dashboard are winning multi-year contracts across integrated delivery networks.
Complete Report Scope:
- By Product
- Asset Tags
- Wearable Tags
- Wireless Sensors
- Software Platforms
- Other Products
- By Technology
- RFID
- Wi-Fi
- Bluetooth Low Energy
- Ultra-Wideband
- ZigBee and Other Technologies
- By Application
- Asset and Inventory Tracking
- Patient and Staff Safety
- Environmental and Condition Monitoring
- Workflow and Capacity Optimization
- Compliance and Audit Trail Management
- By End User
- Hospitals and Integrated Delivery Networks
- Ambulatory Surgery Centers
- Long-Term Care and Senior Living Facilities
- Diagnostic Laboratories and Imaging Centers
- Other Healthcare Institutions
- By Geography
- North America
- United States
- Canada
- Mexico
- South America
- Brazil
- Argentina
- Rest of South America
- Europe
- Germany
- United Kingdom
- France
- Italy
- Spain
- Russia
- Rest of Europe
- Asia Pacific
- China
- Japan
- India
- South Korea
- Australia
- Rest of Asia Pacific
- Middle East and Africa
- Middle East
- Saudi Arabia
- United Arab Emirates
- Turkey
- Rest of Middle East
- Africa
- South Africa
- Nigeria
- Egypt
- Rest of Africa
- Middle East
- North America
Geography Analysis
North America accounted for 37.45% of the revenue in 2025, as integrated delivery networks, such as HCA Healthcare, standardized asset visibility across hundreds of sites. High EHR penetration: Epic and Oracle Cerner cover 70% of U.S. beds, facilitating rapid data integration. Canada accelerated provincial deployments; Ontario Health invested CAD 85 million (USD 63 million) in 2024 to outfit 42 hospitals. Mexico's IMSS pilot aimed to achieve a 25% reduction in rental costs across 18 hospitals. CMS has proposed tying payments to utilization metrics, a policy that could expand the wireless healthcare asset management market if adopted.
The Asia Pacific is the fastest-growing region, with a 25.9% CAGR. China mandated RTLS in all new tertiary hospitals larger than 500 beds, directing CNY 30 billion (USD 4.2 billion) toward deployments. India has embedded asset-tracking in the Ayushman Bharat Digital Mission, which spans 12,000 hospitals. Japan subsidizes up to 50% of elder-care RTLS projects to mitigate a projected 370,000-worker shortfall by 2025. South Korea offers certification incentives, and Australia clarified a lighter regulatory path for non-diagnostic RTLS software. Rapid urbanization, as forecasted by the WHO, is expected to add 400 million new city residents by 2030, driving the need for new hospital construction pre-wired for RTLS.
Europe, the Middle East, and Africa display mixed adoption. Germany, the United Kingdom, France, and Spain are deploying RTLS to meet the Medical Device Regulation's traceability rules. GDPR requires anonymization and local data hosting, benefiting vendors with regional cloud services. Saudi Arabia invested SAR 12 billion (USD 3.2 billion) in 2024 for Vision 2030 hospitals with built-in RTLS. The UAE requires RTLS in all new facilities as part of its ambitious goal to become one of the top 100 global healthcare providers. Africa and South America remain nascent, though private chains in Brazil, South Africa, and Nigeria are piloting deployments to attract medical tourists.
- AiRISTA Flow, Inc.
- Aruba Networks (Hewlett Packard Enterprise Development LP)
- Ascom Holding AG
- Awarepoint Corporation
- CenTrak, Inc.
- Cisco Systems, Inc.
- Cognosos, Inc.
- Decawave Limited
- GE Healthcare Technologies, Inc.
- HID Global Corporation
- Honeywell International Inc.
- Impinj, Inc.
- Intelligent InSites, Inc.
- Midmark Corporation
- Motorola Solutions, Inc.
- Securitas Healthcare USA, Inc.
- Siemens Healthineers AG
- Sonitor Technologies AS
- Stanley Black and Decker, Inc. (STANLEY Healthcare)
- TeleTracking Technologies, Inc.
- Zebra Technologies Corporation
Additional Benefits:
- The market estimate (ME) sheet in Excel format
- 3 months of analyst support
TABLE OF CONTENTS
1 INTRODUCTION
- 1.1 Study Assumptions and Market Definition
- 1.2 Scope of the Study
2 RESEARCH METHODOLOGY
3 EXECUTIVE SUMMARY
4 MARKET LANDSCAPE
- 4.1 Market Overview
- 4.2 Market Drivers
- 4.2.1 Rapid adoption of RFID?based asset tagging
- 4.2.2 Need for real-time asset visibility to cut equipment search time
- 4.2.3 Rising investment in smart hospital infrastructure
- 4.2.4 Edge-AI predictive maintenance reducing device downtime
- 4.2.5 ESG targets driving low-power BLE and UWB retrofit projects
- 4.2.6 Shift to subscription-based RTLS-as-a-Service business models
- 4.3 Market Restraints
- 4.3.1 High upfront hardware and integration costs
- 4.3.2 Data-privacy and cybersecurity compliance hurdles
- 4.3.3 Shortage of RTLS-skilled biomedical engineers
- 4.3.4 RF interference from 5G/Wi-Fi-6E in legacy hospital buildings
- 4.4 Industry Value Chain Analysis
- 4.5 Regulatory Landscape
- 4.6 Technological Outlook
- 4.7 Impact of Macroeconomic Factors
- 4.8 Porter's Five Forces Analysis
- 4.8.1 Threat of New Entrants
- 4.8.2 Bargaining Power of Suppliers
- 4.8.3 Bargaining Power of Buyers
- 4.8.4 Threat of Substitutes
- 4.8.5 Intensity of Competitive Rivalry
5 MARKET SIZE AND GROWTH FORECASTS (VALUE)
- 5.1 By Product
- 5.1.1 Asset Tags
- 5.1.2 Wearable Tags
- 5.1.3 Wireless Sensors
- 5.1.4 Software Platforms
- 5.1.5 Other Products
- 5.2 By Technology
- 5.2.1 RFID
- 5.2.2 Wi-Fi
- 5.2.3 Bluetooth Low Energy
- 5.2.4 Ultra-Wideband
- 5.2.5 ZigBee and Other Technologies
- 5.3 By Application
- 5.3.1 Asset and Inventory Tracking
- 5.3.2 Patient and Staff Safety
- 5.3.3 Environmental and Condition Monitoring
- 5.3.4 Workflow and Capacity Optimization
- 5.3.5 Compliance and Audit Trail Management
- 5.4 By End User
- 5.4.1 Hospitals and Integrated Delivery Networks
- 5.4.2 Ambulatory Surgery Centers
- 5.4.3 Long-Term Care and Senior Living Facilities
- 5.4.4 Diagnostic Laboratories and Imaging Centers
- 5.4.5 Other Healthcare Institutions
- 5.5 By Geography
- 5.5.1 North America
- 5.5.1.1 United States
- 5.5.1.2 Canada
- 5.5.1.3 Mexico
- 5.5.2 South America
- 5.5.2.1 Brazil
- 5.5.2.2 Argentina
- 5.5.2.3 Rest of South America
- 5.5.3 Europe
- 5.5.3.1 Germany
- 5.5.3.2 United Kingdom
- 5.5.3.3 France
- 5.5.3.4 Italy
- 5.5.3.5 Spain
- 5.5.3.6 Russia
- 5.5.3.7 Rest of Europe
- 5.5.4 Asia Pacific
- 5.5.4.1 China
- 5.5.4.2 Japan
- 5.5.4.3 India
- 5.5.4.4 South Korea
- 5.5.4.5 Australia
- 5.5.4.6 Rest of Asia Pacific
- 5.5.5 Middle East and Africa
- 5.5.5.1 Middle East
- 5.5.5.1.1 Saudi Arabia
- 5.5.5.1.2 United Arab Emirates
- 5.5.5.1.3 Turkey
- 5.5.5.1.4 Rest of Middle East
- 5.5.5.2 Africa
- 5.5.5.2.1 South Africa
- 5.5.5.2.2 Nigeria
- 5.5.5.2.3 Egypt
- 5.5.5.2.4 Rest of Africa
- 5.5.5.1 Middle East
- 5.5.1 North America
6 COMPETITIVE LANDSCAPE
- 6.1 Market Concentration
- 6.2 Strategic Moves
- 6.3 Market Share Analysis
- 6.4 Company Profiles (includes Global level Overview, Market level overview, Core Segments, Financials as available, Strategic Information, Market Rank/Share for key companies, Products and Services, and Recent Developments)
- 6.4.1 AiRISTA Flow, Inc.
- 6.4.2 Aruba Networks (Hewlett Packard Enterprise Development LP)
- 6.4.3 Ascom Holding AG
- 6.4.4 Awarepoint Corporation
- 6.4.5 CenTrak, Inc.
- 6.4.6 Cisco Systems, Inc.
- 6.4.7 Cognosos, Inc.
- 6.4.8 Decawave Limited
- 6.4.9 GE Healthcare Technologies, Inc.
- 6.4.10 HID Global Corporation
- 6.4.11 Honeywell International Inc.
- 6.4.12 Impinj, Inc.
- 6.4.13 Intelligent InSites, Inc.
- 6.4.14 Midmark Corporation
- 6.4.15 Motorola Solutions, Inc.
- 6.4.16 Securitas Healthcare USA, Inc.
- 6.4.17 Siemens Healthineers AG
- 6.4.18 Sonitor Technologies AS
- 6.4.19 Stanley Black and Decker, Inc. (STANLEY Healthcare)
- 6.4.20 TeleTracking Technologies, Inc.
- 6.4.21 Zebra Technologies Corporation
7 MARKET OPPORTUNITIES AND FUTURE OUTLOOK
- 7.1 White-space and Unmet-Need Assessment

