PUBLISHER: Mordor Intelligence | PRODUCT CODE: 2121245

PUBLISHER: Mordor Intelligence | PRODUCT CODE: 2121245
Therapeutic Vaccines - Market Share Analysis, Industry Trends & Statistics, Growth Forecasts (2026 - 2031)
According to Mordor Intelligence, the therapeutic vaccines market size is projected to expand from USD 30.44 billion in 2025 and USD 34.25 billion in 2026 to USD 61.77 billion by 2031, registering a CAGR of 12.52% between 2026 and 2031.
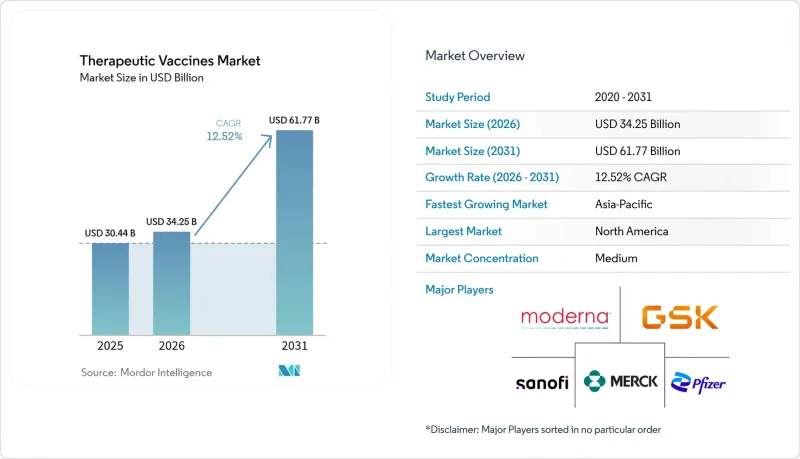
This report is Segmented by Products (Autoimmune Disease Vaccines, Neurological Disease Vaccines, Cancer Vaccines, Infectious Disease Vaccines, Other Products), Technology (Allogeneic Vaccines, Autologous Vaccines), Age Group (Adult, Pediatric, Geriatric), Distribution Channel (Public, Private), and Geography (North America, Europe, and More). The Market Forecasts are Provided in Terms of Value (USD).
Global Therapeutic Vaccines Market Trends and Insights
Rising Prevalence of Chronic & Infectious Diseases
Therapeutic vaccines have moved to the center of multimodal care as chronic conditions coexist with infectious outbreaks. WHO's 2024 Global Health Estimates found non-communicable diseases responsible for 74% of worldwide deaths, a statistic that amplifies oncology and cardiometabolic vaccine demand. Concurrently, global cancer incidence is projected to top 30 million new cases annually by 2030, intensifying the hunt for individualized neoantigen vaccines that target patient-specific mutations. Infectious-disease candidates now pursue functional cures in HIV and shortened regimens in tuberculosis, broadening the therapeutic vaccines market beyond oncology.
Government Funding Intensification for Vaccine R&D
Project NextGen allocated USD 5 billion in 2024 to advance next-generation COVID-19 countermeasures and spin-off technologies, yet BARDA's August 2025 cancellation of USD 500 million in mRNA contracts indicates that future disbursements will hinge on multipurpose clinical value. In China, expedited pathways for domestic cancer vaccines have unlocked fresh capital, while Horizon Europe grants continue to support mRNA and viral-vector platforms. These region-specific policies collectively expand the therapeutic vaccines market, though sponsors must still deliver compelling cost-effectiveness dossiers to secure reimbursement.
Capital-Intensive, High-Risk Clinical Development Cycle
End-to-end expenses reach USD 200-500 million per candidate, while success odds linger below 10%. Personalized neoantigen trials add USD 150,000 per patient in sequencing and bespoke GMP costs. Emerging-market innovators often license out assets to deep-pocketed partners, a dynamic that curtails independent commercialization and tempers growth in the therapeutic vaccines market.
Other drivers and restraints analyzed in the detailed report include:
- Pharma/Biotech Surge in Oncology Vaccine Pipelines
- Breakthrough Approvals of mRNA-Based Therapeutic Vaccines
- Stringent Multi-Jurisdictional Regulatory Hurdles
For complete list of drivers and restraints, kindly check the Table Of Contents.
Segment Analysis
Cancer vaccines held 42.55% therapeutic vaccines market share in 2025, buoyed by combination regimens that prolong progression-free survival. Neurological disease vaccines are projected to clock a 15.85% CAGR to 2031, supported by mid-stage trials of ACI-24.060 and UB-612 that target Alzheimer's pathology.
Autoimmune and advanced infectious-disease candidates add diversification but remain earlier in development, constrained by the need to demonstrate antigen-specific tolerance without compromising systemic immunity. Regulatory requirements differ by indication. Oncology programs often leverage surrogate endpoints such as recurrence-free survival, whereas neurological applications must showcase multi-year cognitive maintenance, a higher evidentiary bar that slows approval yet could deliver large-scale value once met.
Allogeneic formulations generated 55.53% of 2025 revenue thanks to batch economies and rapid distribution. Autologous constructs are set to expand at a 16.75% CAGR through 2031 as AI accelerates neoantigen discovery, shrinking manufacturing cycles to 30-60 days and widening clinical eligibility.
Efficacy divides the two modalities. Allogeneic programs rarely exceed 30% objective response rates, whereas autologous vaccines cross 40% in melanoma and non-small cell lung cancer, a gap that justifies higher production costs among payers keen on durable outcomes.
Complete Report Scope:
- By Products
- Autoimmune Disease Vaccines
- Neurological Disease Vaccines
- Cancer Vaccines
- Infectious Disease Vaccines
- Other Products
- By Technology
- Allogeneic Vaccines
- Autologous Vaccines
- By Age Group
- Adult
- Pediatric
- Geriatric
- By Distribution Channel
- Public
- Private
- By Geography
- North America
- United States
- Canada
- Mexico
- Europe
- Germany
- United Kingdom
- France
- Italy
- Spain
- Rest of Europe
- Asia-Pacific
- China
- India
- Japan
- Australia
- South Korea
- Rest of Asia-Pacific
- Middle East and Africa
- GCC
- South Africa
- Rest of Middle East and Africa
- South America
- Brazil
- Argentina
- Rest of South America
- North America
Geography Analysis
North America led with 42.55% share in 2025, propelled by FDA fast-track designations and concentrated venture backing. Europe follows, leveraging centralized EMA approvals but facing post-authorization pricing delays. Asia-Pacific is the fastest growing therapeutic vaccines market, advancing 13.72% CAGR through 2031 as China streamlines approvals and India attracts lower-cost pivotal trials. Japan's local safety data requirements add 18-24 months to launch cycles but ensure age-tailored protocols for its sizable elderly population.
Latin America, the Middle East, and Africa collectively remain small contributors but display rising interest as expedited reliance pathways let regulators lean on FDA or EMA decisions while domestic sponsors pursue technology transfers.
- Agenus
- AstraZeneca
- Bavarian Nordic
- BioNTech
- Celldex Therapeutic
- CSL Seqirus
- CureVac N.V.
- Gilead Sciences
- GlaxoSmithKline
- Inovio Pharmaceuticals
- Merck
- Moderna
- Novartis
- Nykode Therapeutics
- Pfizer
- Sanofi
- Takeda Pharmaceutical Co.
- Vaccitech plc
Additional Benefits:
- The market estimate (ME) sheet in Excel format
- 3 months of analyst support
TABLE OF CONTENTS
1 Introduction
- 1.1 Study Assumptions & Market Definition
- 1.2 Scope of the Study
2 Research Methodology
3 Executive Summary
4 Market Landscape
- 4.1 Market Overview
- 4.2 Market Drivers
- 4.2.1 Rising prevalence of chronic & infectious diseases
- 4.2.2 Government funding intensification for vaccine R&D
- 4.2.3 Pharma/Biotech surge in oncology vaccine pipelines
- 4.2.4 Breakthrough approvals of mRNA-based therapeutic vaccines
- 4.2.5 AI-driven neo-antigen discovery accelerating personalization
- 4.2.6 On-site modular micro-factory manufacturing models
- 4.3 Market Restraints
- 4.3.1 Capital-intensive, high-risk clinical development cycle
- 4.3.2 Stringent multi-jurisdictional regulatory hurdles
- 4.3.3 Shortage of GMP viral-vector / plasmid manufacturing capacity
- 4.3.4 Late-stage I-O trial failures dampening investor sentiment
- 4.4 Supply-Chain Analysis
- 4.5 Regulatory Landscape
- 4.6 Technological Outlook
- 4.7 Porter's Five Forces
- 4.7.1 Threat of New Entrants
- 4.7.2 Bargaining Power of Buyers
- 4.7.3 Bargaining Power of Suppliers
- 4.7.4 Threat of Substitutes
- 4.7.5 Intensity of Competitive Rivalry
5 Market Size & Growth Forecasts (Value, USD)
- 5.1 By Products
- 5.1.1 Autoimmune Disease Vaccines
- 5.1.2 Neurological Disease Vaccines
- 5.1.3 Cancer Vaccines
- 5.1.4 Infectious Disease Vaccines
- 5.1.5 Other Products
- 5.2 By Technology
- 5.2.1 Allogeneic Vaccines
- 5.2.2 Autologous Vaccines
- 5.3 By Age Group
- 5.3.1 Adult
- 5.3.2 Pediatric
- 5.3.3 Geriatric
- 5.4 By Distribution Channel
- 5.4.1 Public
- 5.4.2 Private
- 5.5 By Geography
- 5.5.1 North America
- 5.5.1.1 United States
- 5.5.1.2 Canada
- 5.5.1.3 Mexico
- 5.5.2 Europe
- 5.5.2.1 Germany
- 5.5.2.2 United Kingdom
- 5.5.2.3 France
- 5.5.2.4 Italy
- 5.5.2.5 Spain
- 5.5.2.6 Rest of Europe
- 5.5.3 Asia-Pacific
- 5.5.3.1 China
- 5.5.3.2 India
- 5.5.3.3 Japan
- 5.5.3.4 Australia
- 5.5.3.5 South Korea
- 5.5.3.6 Rest of Asia-Pacific
- 5.5.4 Middle East and Africa
- 5.5.4.1 GCC
- 5.5.4.2 South Africa
- 5.5.4.3 Rest of Middle East and Africa
- 5.5.5 South America
- 5.5.5.1 Brazil
- 5.5.5.2 Argentina
- 5.5.5.3 Rest of South America
- 5.5.1 North America
6 Competitive Landscape
- 6.1 Market Concentration
- 6.2 Market Share Analysis
- 6.3 Company Profiles (includes Global level Overview, Market level overview, Core Segments, Financials as available, Strategic Information, Market Rank/Share for key companies, Products & Services, and Recent Developments)
- 6.3.1 Agenus Inc.
- 6.3.2 AstraZeneca plc
- 6.3.3 Bavarian Nordic A/S
- 6.3.4 BioNTech SE
- 6.3.5 Celldex Therapeutics Inc.
- 6.3.6 CSL Seqirus
- 6.3.7 CureVac N.V.
- 6.3.8 Gilead Sciences (Kite Pharma)
- 6.3.9 GSK plc
- 6.3.10 Inovio Pharmaceuticals
- 6.3.11 Merck & Co., Inc.
- 6.3.12 Moderna Inc.
- 6.3.13 Novartis AG
- 6.3.14 Nykode Therapeutics
- 6.3.15 Pfizer Inc.
- 6.3.16 Sanofi SA
- 6.3.17 Takeda Pharmaceutical Co.
- 6.3.18 Vaccitech plc
7 Market Opportunities & Future Outlook
- 7.1 White-space & Unmet-Need Assessment

