PUBLISHER: Mordor Intelligence | PRODUCT CODE: 2121304

PUBLISHER: Mordor Intelligence | PRODUCT CODE: 2121304
M2M Connections - Market Share Analysis, Industry Trends & Statistics, Growth Forecasts (2026 - 2031)
According to Mordor Intelligence, the M2M connections market size stands at USD 41.91 billion in 2026 and is forecast to reach USD 59.44 billion by 2031, expanding at a 7.24% CAGR.
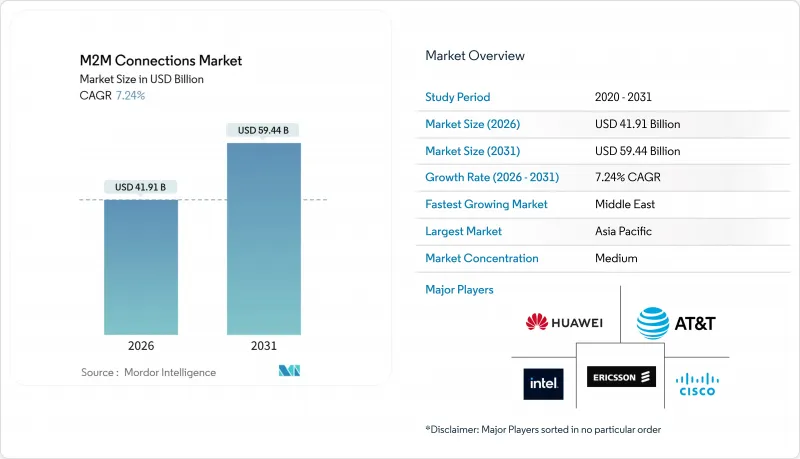
This report is Segmented by Connection Type (Wired, and Wireless), Technology (Cellular Connections, Low Power Wide Area (LPWA), Short Range, Metropolitan Area Network (MAN), Wide Area Fixed, Satellite), Deployment Model (On-Premise, Cloud, Hybrid), End-User Industry (Retail, Banking and Financial Institutions, Telecom and IT, and More), and Geography. Market Forecasts are Provided in Terms of Value (USD).
Global M2M Connections Market Trends and Insights
Proliferation Of IoT Devices Across Industries
Industrial firms are embedding sensors in once-isolated equipment to collect telemetry that feeds predictive maintenance programs, trimming unplanned downtime and energy waste. Manufacturer subsidies and falling module prices, now below USD 5 for NB-IoT chipsets, make connectivity viable for low-value assets. Retail chains run smart shelves that trigger restocks automatically, and pipeline operators outfit thousands of kilometers of infrastructure with pressure sensors that detect leaks within minutes. Momentum is strongest in heavy industry, mining, and petrochemicals, where every hour of outage carries six-figure losses. Equipment makers now ship connectivity-ready machines by default, accelerating the installed base and stimulating recurring service revenue for operators and analytics vendors.
Increasing Number Of Mobile Connections And Smartphone Penetration
Rapid smartphone adoption in emerging markets lowers the marginal cost of adding M2M endpoints by allowing carriers to reuse existing LTE and 5G capacity. India's Department of Telecommunications requires every new tower to support NB-IoT and LTE-M, expanding rural coverage for agriculture sensors. Technicians now provision gateways via Bluetooth and NFC on handheld devices rather than proprietary laptops, cutting installation times from hours to minutes. China Mobile's OneLink platform added 180 million connections in the 12 months ending September 2024, proving the scalability of app-based onboarding. Logistics fleets mirror this shift, as drivers pair smartphones with vehicle units to upload telematics without dedicated scanners, reinforcing the flywheel effect for operator economics.
Privacy And Security Concerns In M2M Communications
Weak authentication and outdated firmware expose critical infrastructure. CISA issued 23 industrial control advisories in 2024, citing hardcoded credentials and insecure bootloaders. A botnet hijacked 40,000 routers after manufacturers shipped devices with default passwords, underscoring provisioning lapses. Healthcare regulators demand end-to-end encryption for insulin pumps and cardiac monitors, raising compliance costs and delaying launches. Enterprises are adopting zero-trust architectures, but retrofitting cryptographic hardware onto legacy sensors remains cost-prohibitive for low-value assets. Certification regimes such as IEC 62443 add 10-15% to the bill of materials, squeezing margins.
Other drivers and restraints analyzed in the detailed report include:
- Growing Adoption Of Telematics In Automotive And Transport
- Integration of eSIM Technology Enabling Massive M2M Scalability
- Lack Of Global M2M Standards And Interoperability
For complete list of drivers and restraints, kindly check the Table Of Contents.
Segment Analysis
Wireless links accounted for 72.33% of the M2M connections market in 2025 and are on track for a 7.66% CAGR through 2031. Mining companies in Australia and Chile cover sprawling pits with LTE-M, connecting autonomous haul trucks without costly fiber runs. Smart agriculture favors wireless because sensors and weather stations spread across fragmented acreage cannot justify trenching. Satellite fills coverage gaps for pipelines and maritime assets, with Iridium and Globalstar offering narrowband service where terrestrial signals fade.
Total cost of ownership keeps tilting toward wireless as module prices drop 40% between 2022 and 2024, while skilled-labor shortages drive up wired-installation costs. Wired Ethernet still holds its ground in building automation, where power-over-Ethernet simplifies provisioning and eliminates battery maintenance. Hybrid topologies are emerging, aggregating wired sensor clusters into cellular backhaul to balance reliability and cost, but the overall momentum remains firmly behind wireless in the M2M connections market.
Cellular connections secured 47.19% of the M2M connections market share in 2025, driven by ubiquitous LTE and 5G networks that support high-bandwidth video and real-time tracking. NB-IoT and LTE-M extend battery life for meters and environmental monitors, propelling LPWA toward the fastest 8.41% CAGR to 2031. China Mobile alone manages more than 1.47 billion IoT lines, the majority of which are on NB-IoT.
Short-range radios like Bluetooth Low Energy and Zigbee dominate wearables and smart home clusters within 100 meters of a gateway. LoRaWAN occupies a middle ground for city-scale deployments where cellular data plans incur unsustainable recurring fees, with Amsterdam and Singapore running public networks that host parking and air-quality sensors. Satellite technologies remain indispensable for maritime, aviation, and remote pipelines, reinforcing a multi-modal landscape that chipset vendors now address with integrated radios capable of dynamic network selection.
Complete Report Scope:
- By Connection Type
- Wired
- Wireless
- By Technology
- Cellular Connections
- Low Power Wide Area (LPWA)
- Short Range
- Metropolitan Area Network (MAN)
- Wide Area Fixed
- Satellite
- By Deployment Model
- On-Premise
- Cloud
- Hybrid
- By End-User Industry
- Retail
- Banking and Financial Institutions
- Telecom and IT
- Healthcare
- Automotive
- Oil and Gas
- Transportation
- Other End-User Industries
- By Geography
- North America
- United States
- Canada
- Mexico
- Europe
- Germany
- United Kingdom
- France
- Russia
- Rest of Europe
- Asia-Pacific
- China
- Japan
- India
- South Korea
- Australia
- Rest of Asia-Pacific
- Middle East and Africa
- Middle East
- Saudi Arabia
- United Arab Emirates
- Rest of Middle East
- Africa
- South Africa
- Egypt
- Rest of Africa
- Middle East
- South America
- Brazil
- Argentina
- Rest of South America
- North America
Geography Analysis
Asia-Pacific accounted for 33.82% of global connections in 2025, driven by state mandates for smart cities and utilities. China's vast installed base is complemented by India's National IoT Policy, which aims to reach 500 million devices by 2027 and offers subsidies to module makers. Japan trials vehicle-to-infrastructure use cases over 5G standalone networks, while South Korea funds private 5G testbeds that anchor factory automation.
North America and Europe show slower connection growth yet richer revenue per line as enterprises focus on value-added analytics and stringent security certifications. The European Union's Radio Equipment Directive, effective January 2025, requires all devices to support secure software updates, raising compliance hurdles but boosting trust in connected endpoints. In the United States, FirstNet provides priority lanes for public-safety M2M traffic, tallying 5 million devices by mid-2024.
The Middle East projects the highest CAGR of 8.91% through 2031, fueled by Saudi Arabia's NEOM deployment of 1 million sensors and Dubai's smart infrastructure, which cut energy use by 30%. South America sees concentrated adoption of precision agriculture in Brazil and Argentina, aided by subsidies from the Brazilian Ministry of Agriculture. Africa lags in rural coverage, but urban NB-IoT rollouts in South Africa and Egypt are enabling metering and fleet management.
- AT&T Inc.
- Vodafone Group Plc
- Deutsche Telekom AG
- China Mobile Ltd.
- Verizon Communications Inc.
- Cisco Systems Inc.
- Huawei Technologies Co., Ltd.
- Intel Corporation
- Sierra Wireless Inc.
- Telefonica SA
- Telit Communications PLC
- Gemalto NV (Thales Group)
- Ericsson AB
- Orange Business Services
- Telenor Group
- China Unicom Ltd.
- VMware Inc.
- Texas Instruments Incorporated
- Quectel Wireless Solutions Co., Ltd.
- Semtech Corporation
Additional Benefits:
- The market estimate (ME) sheet in Excel format
- 3 months of analyst support
TABLE OF CONTENTS
1 INTRODUCTION
- 1.1 Study Assumptions and Market Definition
- 1.2 Scope of the Study
2 RESEARCH METHODOLOGY
3 EXECUTIVE SUMMARY
4 MARKET LANDSCAPE
- 4.1 Market Overview
- 4.2 Market Drivers
- 4.2.1 Proliferation of IoT Devices Across Industries
- 4.2.2 Increasing Number of Mobile Connections and Smartphone Penetration
- 4.2.3 Growing Adoption of Telematics in Automotive and Transport
- 4.2.4 Integration of eSIM Technology Enabling Massive M2M Scalability
- 4.2.5 Rise of Private 5G Networks for Industrial M2M Applications
- 4.2.6 Emerging Demand for Real-Time Edge Analytics Reducing Latency
- 4.3 Market Restraints
- 4.3.1 Privacy and Security Concerns in M2M Communications
- 4.3.2 Lack of Global M2M Standards and Interoperability
- 4.3.3 Scarcity of IPv4 Address Space and Delays in IPv6 Transition
- 4.3.4 Supply-Chain Disruptions for Specialized M2M Chipsets
- 4.4 Industry Value Chain Analysis
- 4.5 Impact of Macroeconomic Factors on the Market
- 4.6 Regulatory Landscape
- 4.7 Technological Outlook
- 4.8 Porter's Five Forces Analysis
- 4.8.1 Bargaining Power of Suppliers
- 4.8.2 Bargaining Power of Buyers
- 4.8.3 Threat of New Entrants
- 4.8.4 Threat of Substitute Products
- 4.8.5 Intensity of Competitive Rivalry
- 4.9 Assessment of the Impact of COVID-19 on the Market
5 MARKET SIZE AND GROWTH FORECASTS (VALUE)
- 5.1 By Connection Type
- 5.1.1 Wired
- 5.1.2 Wireless
- 5.2 By Technology
- 5.2.1 Cellular Connections
- 5.2.2 Low Power Wide Area (LPWA)
- 5.2.3 Short Range
- 5.2.4 Metropolitan Area Network (MAN)
- 5.2.5 Wide Area Fixed
- 5.2.6 Satellite
- 5.3 By Deployment Model
- 5.3.1 On-Premise
- 5.3.2 Cloud
- 5.3.3 Hybrid
- 5.4 By End-User Industry
- 5.4.1 Retail
- 5.4.2 Banking and Financial Institutions
- 5.4.3 Telecom and IT
- 5.4.4 Healthcare
- 5.4.5 Automotive
- 5.4.6 Oil and Gas
- 5.4.7 Transportation
- 5.4.8 Other End-User Industries
- 5.5 By Geography
- 5.5.1 North America
- 5.5.1.1 United States
- 5.5.1.2 Canada
- 5.5.1.3 Mexico
- 5.5.2 Europe
- 5.5.2.1 Germany
- 5.5.2.2 United Kingdom
- 5.5.2.3 France
- 5.5.2.4 Russia
- 5.5.2.5 Rest of Europe
- 5.5.3 Asia-Pacific
- 5.5.3.1 China
- 5.5.3.2 Japan
- 5.5.3.3 India
- 5.5.3.4 South Korea
- 5.5.3.5 Australia
- 5.5.3.6 Rest of Asia-Pacific
- 5.5.4 Middle East and Africa
- 5.5.4.1 Middle East
- 5.5.4.1.1 Saudi Arabia
- 5.5.4.1.2 United Arab Emirates
- 5.5.4.1.3 Rest of Middle East
- 5.5.4.2 Africa
- 5.5.4.2.1 South Africa
- 5.5.4.2.2 Egypt
- 5.5.4.2.3 Rest of Africa
- 5.5.4.1 Middle East
- 5.5.5 South America
- 5.5.5.1 Brazil
- 5.5.5.2 Argentina
- 5.5.5.3 Rest of South America
- 5.5.1 North America
6 COMPETITIVE LANDSCAPE
- 6.1 Market Concentration
- 6.2 Strategic Moves
- 6.3 Market Share Analysis
- 6.4 Company Profiles (includes global level overview, market level overview, core segments, financials as available, strategic information, market rank/share for key companies, products and services, and recent developments)
- 6.4.1 AT&T Inc.
- 6.4.2 Vodafone Group Plc
- 6.4.3 Deutsche Telekom AG
- 6.4.4 China Mobile Ltd.
- 6.4.5 Verizon Communications Inc.
- 6.4.6 Cisco Systems Inc.
- 6.4.7 Huawei Technologies Co., Ltd.
- 6.4.8 Intel Corporation
- 6.4.9 Sierra Wireless Inc.
- 6.4.10 Telefonica SA
- 6.4.11 Telit Communications PLC
- 6.4.12 Gemalto NV (Thales Group)
- 6.4.13 Ericsson AB
- 6.4.14 Orange Business Services
- 6.4.15 Telenor Group
- 6.4.16 China Unicom Ltd.
- 6.4.17 VMware Inc.
- 6.4.18 Texas Instruments Incorporated
- 6.4.19 Quectel Wireless Solutions Co., Ltd.
- 6.4.20 Semtech Corporation
7 MARKET OPPORTUNITIES AND FUTURE OUTLOOK
- 7.1 White-Space and Unmet-Need Assessment

