PUBLISHER: Mordor Intelligence | PRODUCT CODE: 2121765

PUBLISHER: Mordor Intelligence | PRODUCT CODE: 2121765
Natural Fiber Reinforced Composites - Market Share Analysis, Industry Trends & Statistics, Growth Forecasts (2025 - 2031)
According to Mordor Intelligence, the natural fiber reinforced composites market size is expected to grow from 4.73 Million tons in 2025 to 5.13 Million tons in 2026 and is forecast to reach 7.72 Million tons by 2031 at 8.53% CAGR over 2026-2031.
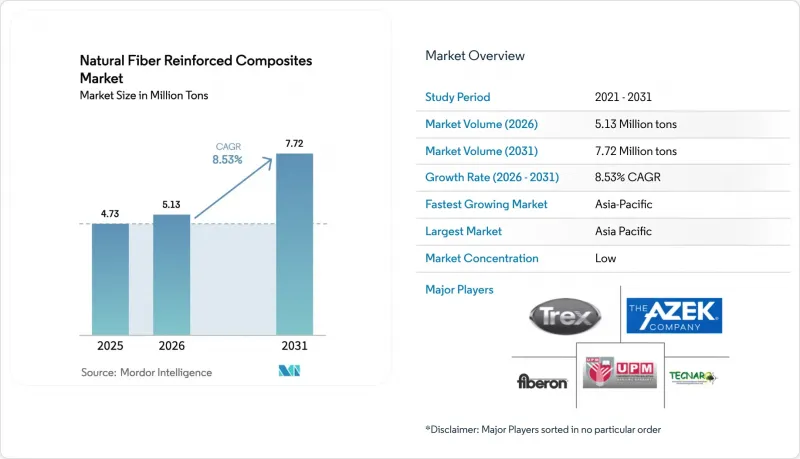
This report is Segmented by Fiber (Wood and Non-Wood), Polymer Matrix (Thermosets, Thermoplastics, and Bio-Based Polymers), Processing Technology (Injection Molding, Compression Molding, Pultrusion, and More), End-User Industry (Automotive, Aerospace, Marine, and More), and Geography (Asia-Pacific, North America, Europe, and More). Market Forecasts are Provided in Terms of Volume (Tons).
Global Natural Fiber Reinforced Composites Market Trends and Insights
Legislative Pressure for Vehicle Recyclability Targets
The updated EU End-of-Life Vehicle Directive active since 2024 obliges automakers to achieve 85% mass recyclability or face fines of EUR 500 per non-compliant car, stimulating immediate substitutions toward flax and hemp door modules. China's Ministry of Industry and Information Technology followed with a 90% recyclability rule for domestic brands by 2030, triggering pilot procurement of bast-fiber battery enclosures. OEMs feel indirect pressure because California assigns lifecycle carbon scores to part dossiers, tilting sourcing toward bio-based compounds with 60% lower embodied CO2 than virgin polypropylene. BMW secured a long-term offtake contract with Bcomp in 2025 to guarantee flax supply and avoid regulatory penalties. As legislative deadlines converge, the natural fiber reinforced composites market experiences embedded demand pull across three continents.
Rapid Adoption of Lightweighting in EV Platforms
Battery-electric cars carry 200 kg extra mass that erodes driving range; substituting glass fiber with hemp composite trims 15% weight from seat backs and parcel shelves, translating to roughly 0.3 km additional range per kilogram saved and USD 15 battery savings per car. Laboratory tests in 2025 showed hemp-PP compounds achieving 85 MPa tensile strength and 6.5 GPa flexural modulus, closing the performance gap with glass fiber. Tesla flagged natural fiber parts as a cost-down lever for its forthcoming Model 2, indicating diffusion beyond premium European marques. Chinese start-ups NIO and XPeng have moved flax door-panel programs into validation for 2027 production, underscoring the global scope of EV-linked pull. These moves accelerate penetration in the natural fiber reinforced composites market ahead of drivetrain parity timelines.
Moisture Absorption Causing Dimensional Instability
Natural fibers absorb 8%-12% water at 85% relative humidity, swelling parts and weakening matrix bonds. Secondary polyurethane coatings or poly-ethylene co-extrusion add USD 0.40-0.60 per kg to manufacturing costs, while acetylation cuts moisture uptake to 4% but inflates fiber prices by 25%. A 2025 ORNL study showed 15% flexural-strength loss after 1,000 h exposure to 95% humidity for hemp-PP panels. Marine uses remain confined to above-waterline cabin modules, and automotive exterior-body integration is delayed until multilayer barriers or hybrid glass skins become routine. This constraint slows adoption in the natural fiber reinforced composites market for moisture-exposed applications.
Other drivers and restraints analyzed in the detailed report include:
- Advancements in High-Throughput Injection and Compression Molding Lines
- Shift Toward Green-Building Certifications in Construction Materials
- Limited Thermal Stability Restricting High-Temperature Processing
For complete list of drivers and restraints, kindly check the Table Of Contents.
Segment Analysis
Wood fiber captured 42.94% natural fiber reinforced composites market share in 2025 owing to its low feedstock cost and established decking supply chains. Non-wood bast fibers will post a 9.45% CAGR through 2031 as BMW and Volvo integrate flax door panels that are 25% thinner yet meet crash stiffness. Hemp decortication capacity in Canada and the U.S. quadrupled between 2024 and 2026, ensuring supply for automotive programs. European projects also blend kenaf and jute into seat shells, raising mechanical efficiency per kilogram.
In parallel, cotton waste feeds sound-insulation mats for EV cabins, and banana and sisal fibers support trunk-liner production in Brazil. Bcomp's ampliTex woven flax unlocks semi-structural aerospace panels that carry 40% premiums over commodity wood flour, nudging suppliers up the value chain. As carbon-reduction metrics grow stricter, OEMs favor fibers that deliver the highest stiffness-to-CO2 ratio, tilting future growth toward premium bast fibers within the natural fiber reinforced composites market.
Thermoplastics comprised 55.82% of the 2025 volume, driven by polypropylene's compatibility with 170 °C molding windows. Mechanical recycling loops lower lifecycle costs for injection-molded interior trims. However, bio-based polymer demand is rising at a 9.21% CAGR. NatureWorks' Ingeo PLA cost fell to USD 2.20 per kg after its Thai expansion, enabling PLA-flax blends in consumer electronics casings at cost parity with ABS. Thermosets stay relevant for wind-turbine spars and marine hulls where resin-transfer molding locks in high glass-transition temperatures, despite recycling obstacles. Polyvinyl chloride with pine flour reinforces window profiles for stringent fire codes, sidestepping halogenated flame retardants. Overall, divergent resin paths reflect end-market needs: automotive pushes recycled PP blends, construction prefers PVC wood composites, and renewable-energy players shift toward epoxy bast-fiber hybrids.
Complete Report Scope:
- By Fiber
- Wood Fiber Composites
- Non-wood Fiber Composites
- Cotton
- Flax
- Kenaf
- Hemp
- Other Non-wood Fibers (Jute, Sisal, Abaca, Coir, PALF, Banana)
- By Polymer Matrix
- Thermosets
- Thermoplastics
- Polyethylene
- Polypropylene
- Polyvinyl Chloride
- High-performance Thermoplastics (PC, PA, PBT)
- Bio-based Polymers (PLA, PHAs, PBS)
- By Processing Technology
- Injection Molding
- Compression Molding
- Pultrusion
- Resin Transfer Molding / VARTM
- Additive Manufacturing (3-D printing with NFC pellets)
- By End-user Industry
- Automotive and Transportation
- Aerospace (Non-critical)
- Marine
- Building and Construction
- Electrical and Electronics
- Sports and Leisure Goods
- Renewable Energy (Wind-turbine components)
- By Geography
- Asia-Pacific
- China
- India
- Japan
- South Korea
- Malaysia
- Thailand
- Indonesia
- Vietnam
- Rest of Asia-Pacific
- North America
- United States
- Canada
- Mexico
- Europe
- Germany
- United Kingdom
- France
- Italy
- Spain
- Nordic Countries
- Turkey
- Russia
- Rest of Europe
- South America
- Brazil
- Argentina
- Colombia
- Rest of South America
- Middle East and Africa
- Saudi Arabia
- Qatar
- United Arab Emirates
- Nigeria
- Egypt
- South Africa
- Rest of Middle East and Africa
- Asia-Pacific
Geography Analysis
Asia-Pacific held 42.25% natural fiber reinforced composites market share in 2025, pacing at 9.10% CAGR through 2031 on the back of Chinese recyclability mandates and India's home-upgrade wave. The region's natural fiber reinforced composites market size will surpass 3.5 million tons by 2031. China's MIIT rules elevate bast-fiber trims for battery enclosures, while Wuhu Haoxuan's new 15,000 t extrusion line supplies decking for municipal walkways. Southeast Asian plants process coconut and banana fibers at sub-USD 300 t feeds, making extruded profiles cost-competitive with vinyl siding.
Europe ranks second in volume yet leads innovation. Germany's suppliers operate supercritical-CO2 treatment to raise flax stiffness 33%, enabling semi-structural seat frames. The U.K.'s BREEAM regime and France's RE2020 code award carbon points for bio-based facades, pushing architects toward wood-fiber PVC cladding. Nordic mills divert forestry by-products into polypropylene Formi blends, tightening circular loops.
North America leverages reclaimed sawdust and post-consumer film. Trex harvests 95% waste inputs, improving gross margins to 38% in 2025. USMCA rules foster regionalized supply chains; Mexican tier-1s mold natural-fiber trunk liners for Detroit automakers. South America sits on abundant bagasse, banana, and sisal feedstocks, yet limited compounding capacity caps domestic conversion.
Middle East and Africa remain exploratory; UAE projects use date-palm fiber core panels in LEED Platinum towers, but broad supply logistics are nascent. These regional dynamics show that regulatory pressure and raw material availability shape the natural fiber reinforced composites market trajectory.
- Amorim Cork Solutions S.A.
- Bcomp Ltd.
- Beologic NV
- BPREG Composites
- Fiberon
- FKuR
- FlexForm Technologies
- Green Dot Bioplastics Inc.
- GreenGran BN
- JELU-WERK J. Ehrler GmbH and Co. KG
- Lingrove Inc.
- Plasthill Oy
- Procotex
- TECNARO GmbH
- Trex Company, Inc.
- UPM
- Wuhu Haoxuan Wood Plastic Composite Co.,Ltd
Additional Benefits:
- The market estimate (ME) sheet in Excel format
- 3 months of analyst support
TABLE OF CONTENTS
1 Introduction
- 1.1 Study Assumptions and Market Definition
- 1.2 Scope of the Study
2 Research Methodology
3 Executive Summary
4 Market Landscape
- 4.1 Market Overview
- 4.2 Market Drivers
- 4.2.1 Legislative pressure for vehicle recyclability targets
- 4.2.2 Rapid adoption of lightweighting in EV platforms
- 4.2.3 Advancements in high-throughput injection and compression molding lines
- 4.2.4 Shift toward green-building certifications in construction materials
- 4.2.5 Emergence of super-critical CO2 fiber-modification lines enabling semi-structural parts
- 4.3 Market Restraints
- 4.3.1 Moisture absorption causing dimensional instability
- 4.3.2 Limited thermal stability restricting high-temperature processing
- 4.3.3 Rising biodigestion demand competing for lignocellulosic feedstock
- 4.4 Value Chain Analysis
- 4.5 Porter's Five Forces
- 4.5.1 Bargaining Power of Suppliers
- 4.5.2 Bargaining Power of Buyers
- 4.5.3 Threat of New Entrants
- 4.5.4 Threat of Substitute Products
- 4.5.5 Degree of Competition
5 Market Size and Growth Forecasts (Volume)
- 5.1 By Fiber
- 5.1.1 Wood Fiber Composites
- 5.1.2 Non-wood Fiber Composites
- 5.1.2.1 Cotton
- 5.1.2.2 Flax
- 5.1.2.3 Kenaf
- 5.1.2.4 Hemp
- 5.1.2.5 Other Non-wood Fibers (Jute, Sisal, Abaca, Coir, PALF, Banana)
- 5.2 By Polymer Matrix
- 5.2.1 Thermosets
- 5.2.2 Thermoplastics
- 5.2.2.1 Polyethylene
- 5.2.2.2 Polypropylene
- 5.2.2.3 Polyvinyl Chloride
- 5.2.2.4 High-performance Thermoplastics (PC, PA, PBT)
- 5.2.3 Bio-based Polymers (PLA, PHAs, PBS)
- 5.3 By Processing Technology
- 5.3.1 Injection Molding
- 5.3.2 Compression Molding
- 5.3.3 Pultrusion
- 5.3.4 Resin Transfer Molding / VARTM
- 5.3.5 Additive Manufacturing (3-D printing with NFC pellets)
- 5.4 By End-user Industry
- 5.4.1 Automotive and Transportation
- 5.4.2 Aerospace (Non-critical)
- 5.4.3 Marine
- 5.4.4 Building and Construction
- 5.4.5 Electrical and Electronics
- 5.4.6 Sports and Leisure Goods
- 5.4.7 Renewable Energy (Wind-turbine components)
- 5.5 By Geography
- 5.5.1 Asia-Pacific
- 5.5.1.1 China
- 5.5.1.2 India
- 5.5.1.3 Japan
- 5.5.1.4 South Korea
- 5.5.1.5 Malaysia
- 5.5.1.6 Thailand
- 5.5.1.7 Indonesia
- 5.5.1.8 Vietnam
- 5.5.1.9 Rest of Asia-Pacific
- 5.5.2 North America
- 5.5.2.1 United States
- 5.5.2.2 Canada
- 5.5.2.3 Mexico
- 5.5.3 Europe
- 5.5.3.1 Germany
- 5.5.3.2 United Kingdom
- 5.5.3.3 France
- 5.5.3.4 Italy
- 5.5.3.5 Spain
- 5.5.3.6 Nordic Countries
- 5.5.3.7 Turkey
- 5.5.3.8 Russia
- 5.5.3.9 Rest of Europe
- 5.5.4 South America
- 5.5.4.1 Brazil
- 5.5.4.2 Argentina
- 5.5.4.3 Colombia
- 5.5.4.4 Rest of South America
- 5.5.5 Middle East and Africa
- 5.5.5.1 Saudi Arabia
- 5.5.5.2 Qatar
- 5.5.5.3 United Arab Emirates
- 5.5.5.4 Nigeria
- 5.5.5.5 Egypt
- 5.5.5.6 South Africa
- 5.5.5.7 Rest of Middle East and Africa
- 5.5.1 Asia-Pacific
6 Competitive Landscape
- 6.1 Market Concentration
- 6.2 Strategic Moves
- 6.3 Market Share(%)/Ranking Analysis
- 6.4 Company Profiles (includes Global level Overview, Market level overview, Core Segments, Financials, Strategic Information, Market Rank/Share, Products and Services, Recent Developments)
- 6.4.1 Amorim Cork Solutions S.A.
- 6.4.2 Bcomp Ltd.
- 6.4.3 Beologic NV
- 6.4.4 BPREG Composites
- 6.4.5 Fiberon
- 6.4.6 FKuR
- 6.4.7 FlexForm Technologies
- 6.4.8 Green Dot Bioplastics Inc.
- 6.4.9 GreenGran BN
- 6.4.10 JELU-WERK J. Ehrler GmbH and Co. KG
- 6.4.11 Lingrove Inc.
- 6.4.12 Plasthill Oy
- 6.4.13 Procotex
- 6.4.14 TECNARO GmbH
- 6.4.15 Trex Company, Inc.
- 6.4.16 UPM
- 6.4.17 Wuhu Haoxuan Wood Plastic Composite Co.,Ltd
7 Market Opportunities and Future Outlook
- 7.1 White-space and Unmet-need Assessment
- 7.2 Growing Product and Technological Innovations

