PUBLISHER: Mordor Intelligence | PRODUCT CODE: 2121809

PUBLISHER: Mordor Intelligence | PRODUCT CODE: 2121809
Sodium Chloride - Market Share Analysis, Industry Trends & Statistics, Growth Forecasts (2026 - 2031)
According to Mordor Intelligence, the sodium chloride market size was valued at 240.76 Million tons in 2025 and is estimated to grow from 253.18 Million tons in 2026 to reach 325.60 Million tons by 2031, at a CAGR of 5.16% during the forecast period (2026-2031).
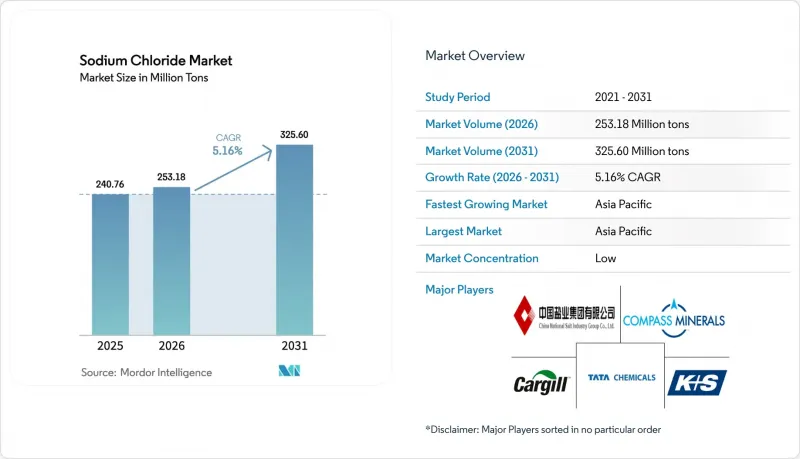
This report is Segmented by Grade (Rock Salt, Solar Salt, and Vacuum Salt), Application (Chemical Production, De-Icing, Water Treatment, Food Processing, Agriculture, Pharmaceuticals, and Other Applications), and Geography (Asia-Pacific, North America, Europe, South America, and Middle East and Africa). The Market Forecasts are Provided in Terms of Volume (Tons).
Global Sodium Chloride Market Trends and Insights
Surging Demand from Packaged-Food and Beverage Processors
The tension between voluntary sodium-reduction targets and rapid packaged-food growth is sustaining bulk consumption. The FDA's Phase I limit of 3,000 milligrams and Phase II goal of 2,300 milligrams per day have not yet suppressed the absolute tonnage of salt bought by manufacturers as urbanization in India and Southeast Asia broadens cold-chain access. India's processed-food industry expanded 11% in 2025, with shelf-stable ready-to-eat meals using sodium chloride for microbial control. Europe's front-of-pack labeling improves transparency, but a 2025 European Commission audit showed only 58% compliance, keeping reformulation behind schedule. Beverage categories such as electrolyte sports drinks grew 14% year over year in 2025, adding another discretionary channel.
Rising Pharmaceutical-Grade NaCl Uptake for Dialysis and IV Fluids
Regulatory shortages logged by U.S. and Australian agencies in 2024 exposed concentrated production footprints that rely on fewer than a dozen vacuum-salt plants worldwide. Each patient on thrice-weekly regimens consumes roughly 312 kilograms of ultra-pure salt annually, and specifications under the U.S. Pharmacopeia and European Pharmacopoeia require more than 99.9% purity plus tight heavy-metal and endotoxin limits. Adoption of mechanical-vapor-recompression evaporators, which slash energy input to 15-25 kilowatt-hours per ton, helps producers meet these standards while defending margins.
Proliferation of Eco-Friendly Organic De-Icers (Acetates, Formates)
Airports and Nordic municipalities are shifting from rock salt to corrosion-free alternatives. Potassium acetate and sodium formate covered 80% of U.S. airfield de-icing tonnage in 2024. The Nordic Swan Ecolabel caps chlorine at 100 mg per kg, diverting 180,000 tons annually into acetate blends. Though acetates cost three to five times more than rock salt, lifecycle savings from reduced bridge corrosion are narrowing total ownership gaps.
Other drivers and restraints analyzed in the detailed report include:
- Increasing Usage of Sodium-Based Batteries
- Municipal Water-Softening Mandates in Hard-Water Regions
- Public-Health Push to Curb Dietary Sodium Intake
For complete list of drivers and restraints, kindly check the Table Of Contents.
Segment Analysis
Vacuum salt is rising at a 6.98% CAGR. Demand stems from MVR evaporators that deliver more than 99.9% purity using one-third the energy of older multi-effect units. Rock salt retained dominance with a 42.30% sodium chloride market share in 2025 because bulk de-icing contracts require low cost more than extreme purity. Solar salt from coastal evaporation ponds meets mid-purity needs in textile dyeing and water softening where minor calcium sulfate residues are tolerated.
Despite rock salt's cost edge-USD 40-60 free-on-board mine versus USD 120-180 for vacuum salt-pharmaceutical and battery cathode makers pay premiums for impurity thresholds below 10 ppm. Tata Chemicals' 1.5 million-ton plant in Gujarat supplies regional dialysate producers, while Cargill's Great Salt Lake operation feeds western U.S. food processors. Solar-salt producers in Shandong and Jiangsu must now manage hypersaline mother liquor under stricter discharge rules, nudging them toward solar-evaporation crystallizers that reclaim magnesium bromide byproducts. Energy-price disparities cap vacuum-salt rollouts in Europe, but MVR retrofits in Germany's Werra mine cut sulfate to 0.2%, enabling bids for pharma contracts previously unreachable.
Complete Report Scope:
- By Grade
- Rock Salt
- Solar Salt
- Vacuum Salt
- By Application
- Chemical Production
- De-icing
- Water Treatment
- Food Processing
- Agriculture
- Pharmaceuticals
- Other Applications (Oil and Gas, Dyeing and Textile, etc.)
- By Geography
- Asia-Pacifc
- China
- India
- Japan
- South Korea
- ASEAN Countries
- Rest of Asia-Pacific
- North America
- United States
- Canada
- Mexico
- Europe
- Germany
- United Kingdom
- France
- Italy
- Spain
- NORDIC Countries
- Rest of Europe
- South America
- Brazil
- Argentina
- Rest of South America
- Middle East and Africa
- Saudi Arabia
- South Africa
- Qatar
- Nigeria
- United Arab Emirates
- Rest of Middle East and Africa
- Asia-Pacifc
Geography Analysis
Asia-Pacific commanded 46.20% of global volume in 2025 and will advance at a 6.44% CAGR, underpinned by Chinese sodium-ion battery cathode capacity and India's 30 million-ton salt output centered in Gujarat. Japan's aging population intensifies pharmaceutical-grade demand, while South Korea's membrane-cell chlor-alkali lines supply semiconductor-grade chemicals. ASEAN petrochemical corridors in Vietnam and Indonesia expand industrial uptake, and Singapore's Tuas desalination plant, commissioned in 2024 at 137,000 m3 per day, raises brine-management volumes.
North America exhibits mature growth. Highways consumed up to 20 million tons of de-icing salt during harsh winters, but municipal budget limits and inventory drawdowns trimmed Compass Minerals' 2024 salt revenue by 6%. California water-softening ordinances add residential-level volume, while Mexico's chlor-alkali capacity around Monterrey expanded to serve near-shoring electronics plants, boosting feedstock demand by over 800,000 tons in 2025.
Europe grows as Nordic Swan procurement bans limit road-salt use. K+S's EUR 25 million ion-exchange upgrade lowered sulfate levels to penetrate pharmaceutical niches. The EU Water Framework Directive forces zero-liquid-discharge adoption, raising production costs but enabling compliance. In South America, pulp-and-paper and lithium brine processors lift needs, while the Middle East leans on desalination, chlor-alkali, and CSP storage. Qatar opened a 1 million-ton vacuum-salt plant in 2025 to backfill pharmaceutical and food demand across the Gulf.
- Cargill Inc.
- China National Salt Industry Corporation
- CK Life Sciences Int'l., (Holdings) Inc.
- Compass Minerals
- Donald Brown Group (PureSalt)
- EUsalt c/o KELLEN
- GHCL Limited
- ICL
- K+S Aktiengesellschaft
- Morton Salt, Inc.
- Nouryon
- Rio Tinto
- Salins Group
- Sudwestdeutsche Salzwerke AG
- Swiss Salt Works AG
- Tata Chemicals
- Wacker Chemie AG
Additional Benefits:
- The market estimate (ME) sheet in Excel format
- 3 months of analyst support
TABLE OF CONTENTS
1 Introduction
- 1.1 Study Assumptions and Market Definition
- 1.2 Scope of the Study
2 Research Methodology
3 Executive Summary
4 Market Landscape
- 4.1 Market Overview
- 4.2 Market Drivers
- 4.2.1 Surging Demand from Packaged-Food and Beverage Processors
- 4.2.2 Rising Pharmaceutical-Grade NaCl Uptake for Dialysis and IV Fluids
- 4.2.3 Increasing Usage of Sodium-Based Batteries
- 4.2.4 Municipal Water-Softening Mandates in Hard-Water Regions
- 4.2.5 Molten-Salt Thermal Storage in Concentrated-Solar-Power Plants
- 4.3 Market Restraints
- 4.3.1 Proliferation of Eco-Friendly Organic De-Icers (Acetates, Formates)
- 4.3.2 Public-Health Push to Curb Dietary Sodium Intake
- 4.3.3 Stringent Regulation on Hypersaline Effluent Disposal
- 4.4 Value Chain Analysis
- 4.5 Porter's Five Forces
- 4.5.1 Bargaining Power of Suppliers
- 4.5.2 Bargaining Power of Buyers
- 4.5.3 Threat of New Entrants
- 4.5.4 Threat of Substitutes
- 4.5.5 Degree of Competition
5 Market Size and Growth Forecasts (Volume)
- 5.1 By Grade
- 5.1.1 Rock Salt
- 5.1.2 Solar Salt
- 5.1.3 Vacuum Salt
- 5.2 By Application
- 5.2.1 Chemical Production
- 5.2.2 De-icing
- 5.2.3 Water Treatment
- 5.2.4 Food Processing
- 5.2.5 Agriculture
- 5.2.6 Pharmaceuticals
- 5.2.7 Other Applications (Oil and Gas, Dyeing and Textile, etc.)
- 5.3 By Geography
- 5.3.1 Asia-Pacifc
- 5.3.1.1 China
- 5.3.1.2 India
- 5.3.1.3 Japan
- 5.3.1.4 South Korea
- 5.3.1.5 ASEAN Countries
- 5.3.1.6 Rest of Asia-Pacific
- 5.3.2 North America
- 5.3.2.1 United States
- 5.3.2.2 Canada
- 5.3.2.3 Mexico
- 5.3.3 Europe
- 5.3.3.1 Germany
- 5.3.3.2 United Kingdom
- 5.3.3.3 France
- 5.3.3.4 Italy
- 5.3.3.5 Spain
- 5.3.3.6 NORDIC Countries
- 5.3.3.7 Rest of Europe
- 5.3.4 South America
- 5.3.4.1 Brazil
- 5.3.4.2 Argentina
- 5.3.4.3 Rest of South America
- 5.3.5 Middle East and Africa
- 5.3.5.1 Saudi Arabia
- 5.3.5.2 South Africa
- 5.3.5.3 Qatar
- 5.3.5.4 Nigeria
- 5.3.5.5 United Arab Emirates
- 5.3.5.6 Rest of Middle East and Africa
- 5.3.1 Asia-Pacifc
6 Competitive Landscape
- 6.1 Market Concentration
- 6.2 Strategic Moves
- 6.3 Market Share(%)/Ranking Analysis
- 6.4 Company Profiles (includes Global-level Overview, Market-level Overview, Core Segments, Financials as available, Strategic Information, Market Rank/Share, Products and Services, Recent Developments)
- 6.4.1 Cargill Inc.
- 6.4.2 China National Salt Industry Corporation
- 6.4.3 CK Life Sciences Int'l., (Holdings) Inc.
- 6.4.4 Compass Minerals
- 6.4.5 Donald Brown Group (PureSalt)
- 6.4.6 EUsalt c/o KELLEN
- 6.4.7 GHCL Limited
- 6.4.8 ICL
- 6.4.9 K+S Aktiengesellschaft
- 6.4.10 Morton Salt, Inc.
- 6.4.11 Nouryon
- 6.4.12 Rio Tinto
- 6.4.13 Salins Group
- 6.4.14 Sudwestdeutsche Salzwerke AG
- 6.4.15 Swiss Salt Works AG
- 6.4.16 Tata Chemicals
- 6.4.17 Wacker Chemie AG
7 Market Opportunities and Future Outlook
- 7.1 White-space and Unmet-Need Assessment
- 7.2 Use as Osmotic Stressor in Micro-algae Cultivation for Biofuels

