PUBLISHER: Mordor Intelligence | PRODUCT CODE: 2121877

PUBLISHER: Mordor Intelligence | PRODUCT CODE: 2121877
Sodium Silicate - Market Share Analysis, Industry Trends & Statistics, Growth Forecasts (2026 - 2031)
According to Mordor Intelligence, the sodium silicate market size is expected to grow from 8.39 million tons in 2025 to 8.79 million tons in 2026 and is forecast to reach 11.12 million tons by 2031 at 4.8% CAGR over 2026-2031.
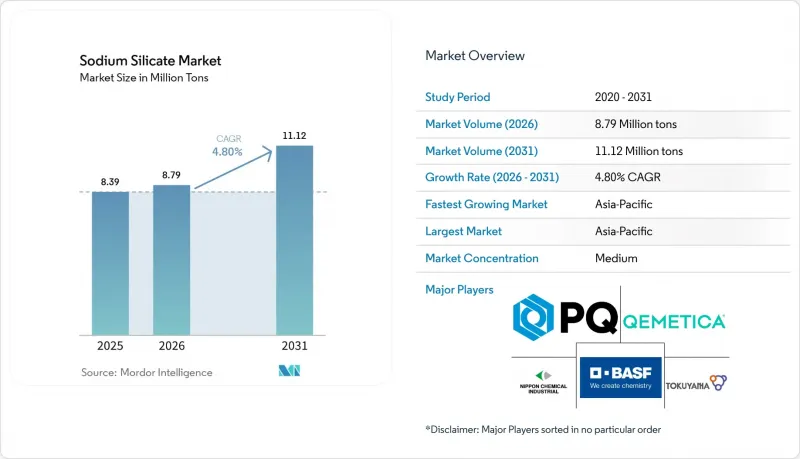
This report is Segmented by Type (Solid and Liquid), Application (Adhesives and Paints, Detergents, Food Preservation, Precipitated Silica, Paper and Pulp, Water Treatment, and Other Applications), and Geography (Asia-Pacific, North America, Europe, South America, and Middle East and Africa). The Market Forecasts are Provided in Terms of Volume (Tons).
Global Sodium Silicate Market Trends and Insights
Mounting Demand for Waste-Paper Recycling
Government mandates for higher recycled-content packaging accelerate the use of sodium silicate in flotation deinking processes. Modern mills consume 8-12 kg of sodium silicate per ton of recovered paper, and the chemical's alkalinity control prevents ink particle re-agglomeration, allowing printers to meet exacting brightness and cleanliness standards. Demand intensifies as plastic substitution drives an additional fiber requirement, especially in Europe, where the Single-Use Plastics Directive prompts converters to shift toward paper-based formats. Suppliers able to deliver consistent pH buffering grades secure long-term contracts with integrated paper groups.
Rising Usage of Precipitated Silica in "Green" Tires
Each ton of precipitated silica requires roughly 1.3 tons of sodium silicate feedstock, creating a direct pull-through effect as tire makers lower rolling resistance to meet evolving fuel-economy labeling rules. High-purity sodium silicate grades with narrow silica-to-soda ratios command premium prices because they yield silica with controlled surface area and porosity-critical parameters for next-generation electric vehicle tires. Capacity additions in Southeast Asia reinforce regional demand momentum.
Health and Safety Hazards of High-Alkali Silicates
Regulators classify concentrated sodium silicate as corrosive, prompting stricter workplace exposure limits and tighter personal protective equipment mandates. Small and mid-size users face higher compliance costs, which can delay adoption in price-sensitive industries such as craft foundries and micro-scale detergent blenders. Large producers that embed advanced closed-loop handling systems and remote monitoring safeguard operations and credibility with downstream customers.
Other drivers and restraints analyzed in the detailed report include:
- Growth of Powder Detergents in Low-Income Economies
- Rapid Industrial-Scale Uptake of Geopolymer Cement
- Volatility in Soda-Ash Prices
For complete list of drivers and restraints, kindly check the Table Of Contents.
Segment Analysis
Liquid products controlled 68.39% of the sodium silicate market in 2025 and are projected to expand at a 5.05% CAGR through 2031. Automated feed systems in water-treatment plants favor liquid chemistry because they eliminate dissolution lag and enable tighter dosage control. Concentrated 50° Baume innovations deliver 25% freight savings while preserving reactivity, a benefit that resonates with export-oriented detergent makers. Solid beads and powder forms retain relevance where shelf life, remote storage, or ultrahigh alkalinity are paramount, yet the value gap narrows as logistics-optimized liquids capture incremental territory.
Manufacturers utilize membrane filtration to fine-tune silica-to-soda ratios in liquid grades, resulting in performance-tailored intermediates for high-purity precipitated silica and specialty adhesive applications. This machinery-intensive capability creates technological barriers to entry, particularly in regions where utilities and skilled labor are scarce. Portfolio breadth in liquids explains why integrated suppliers sustain higher EBITDA margins and secure long-term supply agreements with multinational fast-moving consumer goods companies.
Complete Report Scope:
- By Type
- Solid
- Liquid
- By Application
- Adhesives and Paints
- Detergents
- Food Preservation
- Precipitated Silica
- Paper and Pulp
- Water Treatment
- Other Applications
- By Geography
- Asia-Pacific
- China
- India
- Japan
- South Korea
- Rest of Asia-Pacific
- North America
- United States
- Canada
- Mexico
- Europe
- Germany
- United Kingdom
- Italy
- France
- Rest of Europe
- South America
- Brazil
- Argentina
- Rest of South America
- Middle East and Africa
- Saudi Arabia
- South Africa
- Rest of Middle East and Africa
- Asia-Pacific
Geography Analysis
The Asia-Pacific region accounts for the largest share of global consumption at 42.12% in 2025. Domestic producers in China, including facilities such as Taicang Sinoch's 300,000-ton plant, back-integrate from soda ash to solid and liquid silicates, supporting exports across Southeast Asia. India's detergent industry accelerates the installation of spray-drying towers that rely on liquid silicate dosing control, while Australia fosters the early adoption of geopolymer cement in government-funded transport projects.
North American demand benefits from federal spending on water infrastructure upgrades that specify silicate-based corrosion inhibitors. Shale-basin operators use sodium silicate as a drilling fluid additive that stabilizes clay formations, keeping regional offtake stable even when overall rig counts fluctuate. Premium electronics-grade volumes cluster along the West Coast semiconductor corridor, where high-purity grades support the fabrication of scratch-free glass.
Europe maintains a quality-over-quantity orientation. Stricter effluent discharge rules under the Water Framework Directive increase compliance costs but also favor producers equipped with closed-loop water recycling systems. Consolidation trends, such as Qemetica's November 2024 acquisition of PPG's silica assets, tighten supply in precipitated-silica value chains that primarily feed the regional tire industry. Demand for closed-loop glass recycling chemicals further anchors volume stability.
- Alumina doo Zvornik
- BASF
- C Thai Group
- QEMETICA
- Evonik Industries
- Gujarat Multi Gas Base Chemicals Pvt Ltd
- Hindcon Chemicals Ltd.
- Kiran Global Chem Ltd.
- Nippon Chemical Industrial Co. Ltd.
- Nouryon
- Occidental Petroleum Corporation
- PQ Corporation
- Silmaco
- Tokuyama Corporation
- W. R. Grace & Co.-Conn.
Additional Benefits:
- The market estimate (ME) sheet in Excel format
- 3 months of analyst support
TABLE OF CONTENTS
1 Introduction
- 1.1 Study Assumptions and Market Definition
- 1.2 Scope of the Study
2 Research Methodology
3 Executive Summary
4 Market Landscape
- 4.1 Market Overview
- 4.2 Market Drivers
- 4.2.1 Mounting demand for waste-paper recycling
- 4.2.2 Rising usage of precipitated silica in "green" tyres
- 4.2.3 Growth of powder detergents in low-income economies
- 4.2.4 Rapid industrial-scale uptake of geopolymer cement
- 4.2.5 Circular-economy push for closed-loop glass recycling
- 4.3 Market Restraints
- 4.3.1 Health and safety hazards of high-alkali silicates
- 4.3.2 Volatility in soda-ash prices
- 4.3.3 Tightening EU effluent-discharge limits on silicate liquor
- 4.3.4 Competitive threat from bio-based binders in foundry cores
- 4.4 Value Chain Analysis
- 4.5 Porter's Five Forces Analysis
- 4.5.1 Bargaining Power of Suppliers
- 4.5.2 Bargaining Power of Buyers
- 4.5.3 Threat of New Entrants
- 4.5.4 Threat of Substitutes
- 4.5.5 Degree of Competition
5 Market Size and Growth Forecasts (Volume)
- 5.1 By Type
- 5.1.1 Solid
- 5.1.2 Liquid
- 5.2 By Application
- 5.2.1 Adhesives and Paints
- 5.2.2 Detergents
- 5.2.3 Food Preservation
- 5.2.4 Precipitated Silica
- 5.2.5 Paper and Pulp
- 5.2.6 Water Treatment
- 5.2.7 Other Applications
- 5.3 By Geography
- 5.3.1 Asia-Pacific
- 5.3.1.1 China
- 5.3.1.2 India
- 5.3.1.3 Japan
- 5.3.1.4 South Korea
- 5.3.1.5 Rest of Asia-Pacific
- 5.3.2 North America
- 5.3.2.1 United States
- 5.3.2.2 Canada
- 5.3.2.3 Mexico
- 5.3.3 Europe
- 5.3.3.1 Germany
- 5.3.3.2 United Kingdom
- 5.3.3.3 Italy
- 5.3.3.4 France
- 5.3.3.5 Rest of Europe
- 5.3.4 South America
- 5.3.4.1 Brazil
- 5.3.4.2 Argentina
- 5.3.4.3 Rest of South America
- 5.3.5 Middle East and Africa
- 5.3.5.1 Saudi Arabia
- 5.3.5.2 South Africa
- 5.3.5.3 Rest of Middle East and Africa
- 5.3.1 Asia-Pacific
6 Competitive Landscape
- 6.1 Market Concentration
- 6.2 Strategic Moves
- 6.3 Market Share (%)/Ranking Analysis
- 6.4 Company Profiles (includes Global Level Overview, Market Level Overview, Core Segments, Financials as available, Strategic Information, Market Rank/Share for key companies, Products and Services, and Recent Developments)
- 6.4.1 Alumina doo Zvornik
- 6.4.2 BASF
- 6.4.3 C Thai Group
- 6.4.4 QEMETICA
- 6.4.5 Evonik Industries
- 6.4.6 Gujarat Multi Gas Base Chemicals Pvt Ltd
- 6.4.7 Hindcon Chemicals Ltd.
- 6.4.8 Kiran Global Chem Ltd.
- 6.4.9 Nippon Chemical Industrial Co. Ltd.
- 6.4.10 Nouryon
- 6.4.11 Occidental Petroleum Corporation
- 6.4.12 PQ Corporation
- 6.4.13 Silmaco
- 6.4.14 Tokuyama Corporation
- 6.4.15 W. R. Grace & Co.-Conn.
7 Market Opportunities and Future Outlook
- 7.1 White-Space and Unmet-Need Assessment

