PUBLISHER: Mordor Intelligence | PRODUCT CODE: 2121927

PUBLISHER: Mordor Intelligence | PRODUCT CODE: 2121927
Functional Water - Market Share Analysis, Industry Trends & Statistics, Growth Forecasts (2026 - 2031)
According to Mordor Intelligence, the functional water market size is expected to increase from USD 9.12 billion in 2025 to USD 9.91 billion in 2026 and reach USD 15.04 billion by 2031, growing at a CAGR of 8.70% over 2026-2031.
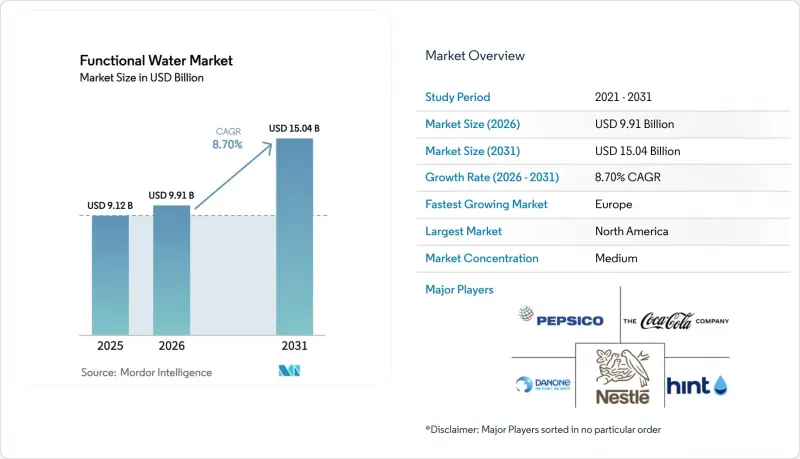
This report is Segmented by Product Type (Vitamin-Fortified, Protein, Electrolyte/Mineral, Others), Packaging (PET Bottle, Can, Others), Flavor (Flavored, Non-Flavored), Distribution Channel (Supermarkets/Hypermarkets, Convenience/Grocery Stores, Online Retail Stores, Other Distribution Channels), and Geography (North America, Europe, and More). The Market Forecasts are Provided in Terms of Value (USD).
Global Functional Water Market Trends and Insights
Rising Health Awareness Fuels Demand for Beverages with Added Vitamins, Minerals, And Electrolytes
Since the pandemic, consumers have become more focused on checking ingredient labels. Functional water has gained popularity as a low-calorie option for delivering essential nutrients. The FDA's 21 CFR 165.110 standards allow bottled water to include safe ingredients like vitamins and minerals, as long as the labels clearly show the nutrient content. This regulation enables brands to add B-vitamins, vitamin C, zinc, and magnesium without classifying the products as dietary supplements, which would require stricter approval processes. Similarly, in Europe, EFSA's health claims regulation (EC No 1924/2006) allows nutrient function claims if specific minimum levels are met, supporting market growth in the region. Additionally, electrolyte-enhanced water has become a favorite among fitness enthusiasts who want hydration without the high sugar content of traditional sports drinks. This shift has significantly boosted functional beverage sales in the U.S., which grew by over 54% between March 2020 and March 2024.
Increasing Preference for Low-Calorie Alternatives Boosts Functional Water Consumption
Health-conscious consumers are increasingly moving away from sugary beverages and opting for zero- or low-calorie functional waters. These drinks offer perceived health benefits while supporting weight management goals. To meet this demand, The Coca-Cola Company plans to launch "vitaminwater zero sugar" variants in March 2025. These beverages provide vitamin fortification without calories, using stevia and erythritol as sweeteners. In the European Union, the Sweeteners Directive (94/35/EC) allows the use of approved non-nutritive sweeteners in beverages, enabling companies to innovate while staying compliant with regulations. This trend is also gaining traction in urban markets across the Asia Pacific, where rising diabetes rates and government-led sugar reduction campaigns are driving changes in beverage offerings. The segment's 1.5% CAGR highlights its growth potential, supported by faster reformulation processes and increasing consumer awareness of sugar alternatives.
High Product Prices Limit Accessibility in Price-Sensitive Markets
The higher cost of functional waters compared to regular bottled water creates a significant challenge for market growth in price-sensitive regions. Although premium pricing boosts brand profitability, it limits these products to higher-income consumers. This issue is particularly prominent in emerging economies, where affordability often takes precedence over functional benefits. The market's vulnerability becomes more apparent during economic downturns, as seen during recent inflationary periods. Manufacturers who adopt tiered pricing models while maintaining product quality can expand their reach to a broader audience. This strategy is especially important in emerging markets, where price remains the primary obstacle to growth.
Other drivers and restraints analyzed in the detailed report include:
- Busy Lifestyles Increase Demand for Convenient and Portable Health Beverages
- Strategic Endorsements and Marketing by Celebrities and Athletes Enhance Brand Appeal
- Brand Differentiation in a Crowded Functional Beverage Market Hinders Growth
For complete list of drivers and restraints, kindly check the Table Of Contents.
Segment Analysis
In 2025, vitamin-fortified functional water made up 35.54% of the market revenue, showcasing strong consumer interest in hydration products with added health benefits. This segment's leadership is supported by clear regulations from the FDA and EFSA, which allow vitamin fortification as long as product labels are accurate and not misleading. In March 2025, Coca-Cola Company introduced a refreshed 'vitaminwater' line, featuring zero-sugar options fortified with B-vitamins and vitamin C. These products target calorie-conscious consumers looking for functional benefits without compromising their weight management goals. The segment is expected to grow at a 9.65% CAGR through 2031, driven by advancements in bioavailable vitamin forms, such as methylcobalamin over cyanocobalamin for B12, and nutrient combinations that improve absorption.
Consumers are already familiar with the benefits of vitamins, which reduces the need for extensive education compared to newer ingredients like nootropics or adaptogens. Brands can use health claims approved under EFSA Regulation (EC) No 1924/2006, such as "Vitamin C supports the normal function of the immune system," to effectively communicate their value to health-conscious shoppers. With a projected 9.65% CAGR-the highest among product types-vitamin-fortified functional water is positioned as the primary growth driver in the category. Innovations are focusing on clean-label formulations, natural colorants, and sustainable packaging to meet evolving consumer preferences.
PET bottles commanded 85.12% of 2025 functional water sales, entrenched by their lightweight, shatter-resistant properties and established manufacturing infrastructure. However, aluminum cans are set to expand at 10.43% CAGR through 2031, driven by sustainability mandates and consumer perception of aluminum as infinitely recyclable compared to plastic's lower recycling rates. Ball Corporation and Crown Holdings have both reported capacity expansions to meet surging demand for aluminum beverage packaging, with Ball announcing investments in new can production lines across North America and Europe in 2024.
The shift toward cans is most pronounced among younger demographics who prioritize environmental sustainability and associate aluminum packaging with premium positioning. Liquid Death's January 2026 launch of caffeinated functional water in 16-ounce aluminum cans exemplifies how brands are leveraging packaging format to differentiate in crowded retail environments. According to the International Aluminium Institute, aluminum's 76% global recycling rate substantially exceeds PET's recycling performance, presenting both environmental advantages and strategic marketing opportunities for brands prioritizing sustainability initiatives .
Complete Report Scope:
- By Product Type
- Vitamin
- Protein
- Electrolyte/Mineral
- Others
- By Packaging
- PET Bottle
- Can
- Others
- By Flavor
- Flavored
- Non-Flavored
- By Distribution Channel
- Supermarkets/Hypermarkets
- Convenience/Grocery Stores
- Online Retail Stores
- Other Distribution Channels
- By Geography
- North America
- United States
- Canada
- Mexico
- Rest of North America
- Europe
- Germany
- United Kingdom
- Italy
- France
- Spain
- Netherlands
- Poland
- Belgium
- Sweden
- Rest of Europe
- Asia Pacific
- China
- India
- Japan
- Australia
- Indonesia
- South Korea
- Thailand
- Singapore
- Rest of Asia-Pacific
- South America
- Brazil
- Argentina
- Colombia
- Chile
- Peru
- Rest of South America
- Middle East and Africa
- South Africa
- Saudi Arabia
- United Arab Emirates
- Nigeria
- Egypt
- Morocco
- Turkey
- Rest of Middle East and Africa
- North America
Geography Analysis
In 2025, North America dominated the functional water market, capturing a substantial 51.22% share. This leadership is attributed to factors such as high consumer awareness about health benefits, well-established retail distribution networks, and a strong fitness-oriented culture that values functional beverages. Furthermore, North America plays a critical role as an innovation hub, where leading companies like PepsiCo and Coca-Cola introduce and test new functional water products before expanding them to global markets.
Europe represents the fastest-growing regional market with a projected CAGR of 9.17% from 2026-2031. The region benefits from established regulatory frameworks for health claims and increasing consumer understanding of functional ingredients. European consumers demonstrate heightened scrutiny of health claims, leading to an emphasis on scientific substantiation and clean-label formulations. The EU's Nutrition and Health Claims Regulation influences the market by requiring scientific validation of functional claims, creating opportunities for brands meeting these standards . In the Asia-Pacific region, factors such as urbanization, rising disposable incomes, and growing health consciousness are fueling demand, particularly in countries like Japan, South Korea, and Australia.
The Middle East and Africa present emerging opportunities, although growth patterns vary across these regions. Urban areas are adopting functional water at a faster pace, while rural areas face challenges such as limited distribution networks and price sensitivity. In the Middle East, concerns over water scarcity are driving demand for functional water brands that offer premium hydration while promoting water conservation. Globally, the functional water market is shifting toward localized products tailored to regional tastes and specific functional needs, moving away from standardized global offerings.
- The Coca-Cola Company
- PepsiCo, Inc.
- Danone S.A.
- Nestle S.A.
- Hint Inc.
- Dr Pepper Snapple Group
- Flow Beverage Corp.
- Centr Brands Corp.
- Disruptive Beverages Inc.
- The Vita Coco Company
- Balance Water Company LLC
- Perfect Hydration
- Nirvana Water Sciences Corp.
- Nooma Inc.
- Vitamin Well
- The Wonderful Company LLC
- CENTR Brands Corp.
- Function Drinks
- Voss Water
- Good Idea Inc.
Additional Benefits:
- The market estimate (ME) sheet in Excel format
- 3 months of analyst support
TABLE OF CONTENTS
1 INTRODUCTION
- 1.1 Study Assumptions and Market Definition
- 1.2 Scope of the Study
2 RESEARCH METHODOLOGY
3 EXECUTIVE SUMMARY
4 MARKET LANDSCAPE
- 4.1 Market Overview
- 4.2 Market Drivers
- 4.2.1 Rising Health Awareness Fuels Demand for Beverages with Added Vitamins, Minerals, And Electrolytes
- 4.2.2 Increasing Preference for Low-Calorie Alternatives Boosts Functional Water Consumption
- 4.2.3 Busy Lifestyles Increase Demand for Convenient and Portable Health Beverages.
- 4.2.4 Strategic Endorsements and Marketing by Celebrities and Athletes Enhance Brand Appeal
- 4.2.5 Product Innovations with Botanical Extracts and Nootropics Attract Wellness-Oriented Consumers
- 4.2.6 Expansion of Modern Retail and Online Channels Improves Product Accessibility Globally
- 4.3 Market Restraints
- 4.3.1 High Product Prices Limit Accessibility in Price-Sensitive Markets
- 4.3.2 Brand Differentiation in a Crowded Functional Beverage Market Hinders Growth
- 4.3.3 Intense Competition from Flavored Water, Sports Drinks, And Energy Beverages
- 4.3.4 Lack of Consumer Awareness in Rural and Underdeveloped Regions Hampers Market Growth
- 4.4 Regulatory Outlook
- 4.5 Technology Outlook
- 4.6 Porter's Five Forces
- 4.6.1 Threat of New Entrants
- 4.6.2 Bargaining Power of Buyers
- 4.6.3 Bargaining Power of Suppliers
- 4.6.4 Threat of Substitute Products
- 4.6.5 Intensity of Competitive Rivalry
5 MARKET SIZE AND GROWTH FORECASTS (VALUE)
- 5.1 By Product Type
- 5.1.1 Vitamin
- 5.1.2 Protein
- 5.1.3 Electrolyte/Mineral
- 5.1.4 Others
- 5.2 By Packaging
- 5.2.1 PET Bottle
- 5.2.2 Can
- 5.2.3 Others
- 5.3 By Flavor
- 5.3.1 Flavored
- 5.3.2 Non-Flavored
- 5.4 By Distribution Channel
- 5.4.1 Supermarkets/Hypermarkets
- 5.4.2 Convenience/Grocery Stores
- 5.4.3 Online Retail Stores
- 5.4.4 Other Distribution Channels
- 5.5 By Geography
- 5.5.1 North America
- 5.5.1.1 United States
- 5.5.1.2 Canada
- 5.5.1.3 Mexico
- 5.5.1.4 Rest of North America
- 5.5.2 Europe
- 5.5.2.1 Germany
- 5.5.2.2 United Kingdom
- 5.5.2.3 Italy
- 5.5.2.4 France
- 5.5.2.5 Spain
- 5.5.2.6 Netherlands
- 5.5.2.7 Poland
- 5.5.2.8 Belgium
- 5.5.2.9 Sweden
- 5.5.2.10 Rest of Europe
- 5.5.3 Asia Pacific
- 5.5.3.1 China
- 5.5.3.2 India
- 5.5.3.3 Japan
- 5.5.3.4 Australia
- 5.5.3.5 Indonesia
- 5.5.3.6 South Korea
- 5.5.3.7 Thailand
- 5.5.3.8 Singapore
- 5.5.3.9 Rest of Asia-Pacific
- 5.5.4 South America
- 5.5.4.1 Brazil
- 5.5.4.2 Argentina
- 5.5.4.3 Colombia
- 5.5.4.4 Chile
- 5.5.4.5 Peru
- 5.5.4.6 Rest of South America
- 5.5.5 Middle East and Africa
- 5.5.5.1 South Africa
- 5.5.5.2 Saudi Arabia
- 5.5.5.3 United Arab Emirates
- 5.5.5.4 Nigeria
- 5.5.5.5 Egypt
- 5.5.5.6 Morocco
- 5.5.5.7 Turkey
- 5.5.5.8 Rest of Middle East and Africa
- 5.5.1 North America
6 COMPETITIVE LANDSCAPE
- 6.1 Market Concentration
- 6.2 Strategic Moves
- 6.3 Market Ranking
- 6.4 Company Profiles (includes Global level Overview, Market level overview, Core Segments, Financials as available, Strategic Information, Market Rank/Share for key companies, Products and Services, and Recent Developments)
- 6.4.1 The Coca-Cola Company
- 6.4.2 PepsiCo, Inc.
- 6.4.3 Danone S.A.
- 6.4.4 Nestle S.A.
- 6.4.5 Hint Inc.
- 6.4.6 Dr Pepper Snapple Group
- 6.4.7 Flow Beverage Corp.
- 6.4.8 Centr Brands Corp.
- 6.4.9 Disruptive Beverages Inc.
- 6.4.10 The Vita Coco Company
- 6.4.11 Balance Water Company LLC
- 6.4.12 Perfect Hydration
- 6.4.13 Nirvana Water Sciences Corp.
- 6.4.14 Nooma Inc.
- 6.4.15 Vitamin Well
- 6.4.16 The Wonderful Company LLC
- 6.4.17 CENTR Brands Corp.
- 6.4.18 Function Drinks
- 6.4.19 Voss Water
- 6.4.20 Good Idea Inc.
7 MARKET OPPORTUNITIES AND FUTURE OUTLOOK

