PUBLISHER: Mordor Intelligence | PRODUCT CODE: 2121969

PUBLISHER: Mordor Intelligence | PRODUCT CODE: 2121969
Philippines Plastics - Market Share Analysis, Industry Trends & Statistics, Growth Forecasts (2026 - 2031)
According to Mordor Intelligence, the Philippines plastics market size was valued at USD 3.06 billion in 2025 and is estimated to grow from USD 3.20 billion in 2026 to reach USD 4.01 billion by 2031, at a CAGR of 4.61% during the forecast period (2026-2031).
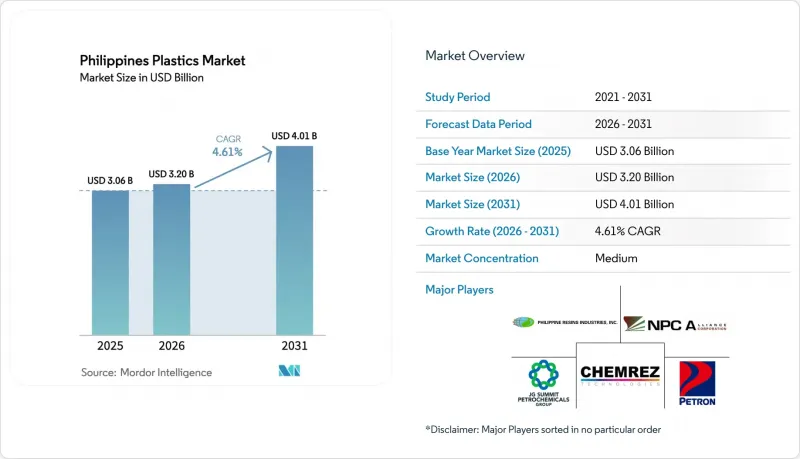
This report is Segmented by Type (Traditional Plastics, Engineering Plastics, and Bioplastics), Technology (Blow Moulding, Extrusion, Injection Moulding, and Other Technologies) and Application (Packaging, Electrical & Electronics, Building & Construction, Automotive & Transportation, Furniture & Bedding, and Other Applications). Market Forecasts are Provided in Terms of Value (USD).
Philippines Plastics Market Trends and Insights
Surging Packaging & E-commerce Demand
E-commerce penetration reached 15% in 2024 and continues to climb, pushing parcel volumes that favor light-weight, flexible films over rigid formats. Leading platforms now embed recycled-content guidelines into seller scorecards, encouraging the shift from virgin polypropylene mailers to recycled LDPE or rPET films. FMCG brands responding to EPR quotas have doubled take-back budgets for sachet and bottle collection, which increases demand for locally sourced PCR-grade pellets. As payment failures trigger repeat shipments, more bubble-wrap and corrugated liners are used per successful delivery, enlarging the overall packaging footprint that feeds directly into the Philippines plastics market. This cycle of volume growth, platform-led sustainability, and regulatory pressure is steering converters toward certified recycled materials that command premiums yet still widen the Philippines plastics market.
Government Infrastructure Build-Out Boosts Construction Plastics
The national budget allocated PHP 1.545 trillion (USD 27.5 billion) to infrastructure in 2024, equivalent to 5.8% of GDP, channeling orders for HDPE and uPVC pipe, geotextiles, and EPS insulation into large public works. Contractors prefer corrosion-resistant plastic pipe over ductile iron to lower freight costs across the archipelago's 7,641 islands. Climate-resilient design standards now specify UV-stabilized polypropylene geotextiles to protect flood-prone highways, nudging the replacement of sand-filled sacks with longer-lasting plastic alternatives. The Advanced Manufacturing Center recorded 79 client engagements in additive manufacturing, signaling that 3D-printed fittings and couplings could localize value within the Philippines plastics market. Sustained capital expenditure keeps construction grades at the core of domestic resin demand, underpinning stable volumes even when consumer spending softens.
Dependence on Imported Naphtha & Polymers
Plastics import value jumped 24.75% year-on-year to USD 288.57 million in January 2025, underscoring near-total reliance on foreign feedstocks. Only one local cracker-JG Summit's Batangas complex-converts naphtha into olefins, and its 480,000-tonne ethylene output covers a fraction of domestic demand. Spot PP and PE prices track China's export swings, so converters struggle to forecast margins and must pre-pay resin 60-90 days before collecting from FMCG buyers, tightening working capital. Currency volatility amplifies cost uncertainty because resin is invoiced in USD while most finished goods sell in PHP. These dynamics keep upstream risk a persistent drag on the Philippines plastics market.
Other drivers and restraints analyzed in the detailed report include:
- Rising Automotive Wire-Harness Exports Need Engineering Plastics
- PEZA Tax Incentives Favor Local Compounders
- Single-Use-Plastic Bans & EPR Law Compliance Costs
For complete list of drivers and restraints, kindly check the Table Of Contents.
Segment Analysis
Traditional plastics generated 70.18% of the Philippines plastics market size in 2025, anchored by polyethylene and polypropylene used in flexible packaging, pipes, and household goods. Commodity margins remain thin as Chinese oversupply keeps regional prices subdued, motivating converters to look for differentiation. D&L Polymer & Colours' January 2025 launch of plant-fiber plastics replaced up to 40% of virgin resin with abaca and pineapple fibers, reducing weight and improving stiffness in appliance housings. Engineering grades, including nylon 66 and PBT, maintain a smaller share yet yield premiums of 50%-100% over PE, cushioning producers from spot volatility.
Bioplastics lead growth at a 5.06% CAGR through 2031. Local producers OIKOS and EcoNest currently import starch pellets, but feasibility work for a 30,000-tonne PLA line suggests that cassava feedstock from Northern Mindanao and BARMM could localize supply, trimming import bills and boosting the Philippines plastics market. However, bioplastic resin still costs 40%-100% more than conventional polymers, and EPR regulations do not yet provide explicit price offsets, limiting near-term penetration. Continued R&D by the Industrial Technology Development Institute on nanocellulose and PHA could narrow that gap and diversify raw-material options, but scale-up hinges on electricity pricing and credit access.
Complete Report Scope:
- By Type
- Traditional Plastics
- Engineering Plastics
- Bioplastics
- By Technology
- Blow Moulding
- Extrusion
- Injection Moulding
- Other Technologies
- By Application
- Packaging
- Electrical & Electronics
- Building & Construction
- Automotive & Transportation
- Furniture & Bedding
- Other Applications
List of Companies Covered in this Report:
- Braskem
- Chemrez Technologies
- Chevron Phillips Chemical Company LLC
- D&L Industries
- Dow
- Dupont
- ExxonMobil Chemical Corporation
- Hanwha Group
- ITOCHU Corporation
- JG Summit Petrochemicals Group
- LyondellBasell
- Mitsubishi Chemical Group Corporation
- Nan Ya Plastics Corporation
- NPC Alliance Corporation
- Petron Corporation
- Philippine Resins Industries, Inc.
- SABIC
- SGS
- Sumitomo Chemical Asia Pte Ltd.
- TotalEnergies Corbion
Additional Benefits:
- The market estimate (ME) sheet in Excel format
- 3 months of analyst support
TABLE OF CONTENTS
1 Introduction
- 1.1 Study Assumptions
- 1.2 Scope of the Study
2 Research Methodology
3 Executive Summary
4 Market Landscape
- 4.1 Market Overview
- 4.2 Market Drivers
- 4.2.1 Surging packaging & e-commerce demand
- 4.2.2 Government infrastructure build-out boosts construction plastics
- 4.2.3 Rising automotive wire-harness exports need engineering plastics
- 4.2.4 PEZA tax incentives favour local compounders
- 4.2.5 Brand commitments spur PCR-grade resin demand (under-radar)
- 4.3 Market Restraints
- 4.3.1 Dependence on imported naphtha & polymers
- 4.3.2 Single-use-plastic bans & EPR law compliance costs
- 4.3.3 High energy & domestic logistics expenses
- 4.4 Value Chain Analysis
- 4.5 Porter's Five Forces
- 4.5.1 Threat of New Entrants
- 4.5.2 Bargaining Power of Buyers
- 4.5.3 Bargaining Power of Suppliers
- 4.5.4 Threat of Substitutes
- 4.5.5 Degree of Competition
5 Market Size & Growth Forecasts (Value)
- 5.1 By Type
- 5.1.1 Traditional Plastics
- 5.1.2 Engineering Plastics
- 5.1.3 Bioplastics
- 5.2 By Technology
- 5.2.1 Blow Moulding
- 5.2.2 Extrusion
- 5.2.3 Injection Moulding
- 5.2.4 Other Technologies
- 5.3 By Application
- 5.3.1 Packaging
- 5.3.2 Electrical & Electronics
- 5.3.3 Building & Construction
- 5.3.4 Automotive & Transportation
- 5.3.5 Furniture & Bedding
- 5.3.6 Other Applications
6 Competitive Landscape
- 6.1 Market Concentration
- 6.2 Strategic Moves (M&A, JVs, Capacity Adds)
- 6.3 Market Share(%)/Ranking Analysis
- 6.4 Company Profiles (includes Global level Overview, Market level overview, Core Segments, Financials as available, Strategic Information, Market Rank/Share for key companies, Products & Services, and Recent Developments)
- 6.4.1 Braskem
- 6.4.2 Chemrez Technologies
- 6.4.3 Chevron Phillips Chemical Company LLC
- 6.4.4 D&L Industries
- 6.4.5 Dow
- 6.4.6 Dupont
- 6.4.7 ExxonMobil Chemical Corporation
- 6.4.8 Hanwha Group
- 6.4.9 ITOCHU Corporation
- 6.4.10 JG Summit Petrochemicals Group
- 6.4.11 LyondellBasell
- 6.4.12 Mitsubishi Chemical Group Corporation
- 6.4.13 Nan Ya Plastics Corporation
- 6.4.14 NPC Alliance Corporation
- 6.4.15 Petron Corporation
- 6.4.16 Philippine Resins Industries, Inc.
- 6.4.17 SABIC
- 6.4.18 SGS
- 6.4.19 Sumitomo Chemical Asia Pte Ltd.
- 6.4.20 TotalEnergies Corbion
7 Market Opportunities & Future Outlook
- 7.1 White-space & Unmet-need Assessment

