PUBLISHER: Mordor Intelligence | PRODUCT CODE: 2122050

PUBLISHER: Mordor Intelligence | PRODUCT CODE: 2122050
Centrifugal Compressor - Market Share Analysis, Industry Trends & Statistics, Growth Forecasts (2026 - 2031)
According to Mordor Intelligence, the centrifugal compressor market size is estimated at USD 8.46 billion in 2026, and is expected to reach USD 11.08 billion by 2031, at a CAGR of 5.55% during the forecast period (2026-2031).
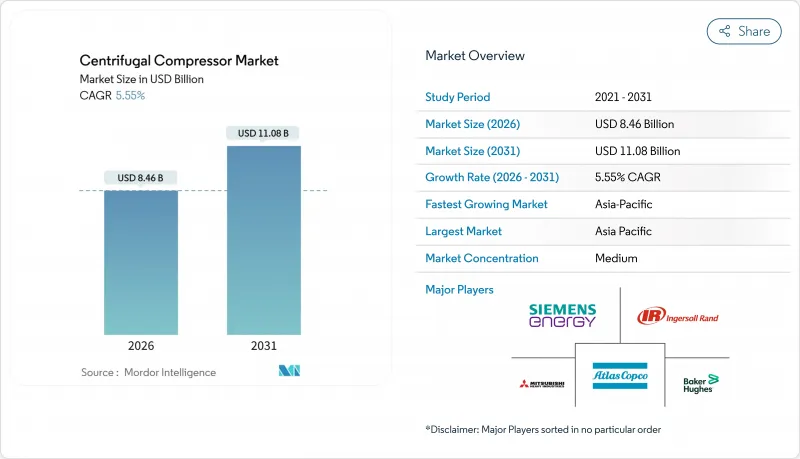
This report is Segmented by Compressor Design (Straight-Through and Integrally Geared), Stage (Single-Stage and Multi-Stage), Cooling Method (Air-Cooled and Water-Cooled), End-User Industry (Oil and Gas, Petrochemicals and Chemicals, Power Generation, Metals and Mining, Food and Beverage, and Others), and Geography (North America, Europe, Asia-Pacific, South America, and Middle East and Africa).
Global Centrifugal Compressor Market Trends and Insights
Surging Natural-Gas Pipeline Build-Outs
North American projects are moving from mega trunk lines toward laterals that link Permian and Appalachian fields to Gulf Coast LNG terminals. Seven U.S. pipeline approvals in 2024 alone added 3.2 bcf/d of capacity, each requiring multiple centrifugal compressor stations. Kinder Morgan's Texas-Louisiana line deployed six 22,500-horsepower units able to handle fluctuating inlet pressures without surge losses. In Saudi Arabia, Phase IV of the Master Gas System will add 3 bcf/d by 2027 using compact integrally geared machines to save plot space. Middle-Eastern operators favor modular skids that cut field-installation time from 18 months to 12 months, improving tariff recovery timelines. As these networks increase mileage, rotational equipment replacement cycles shorten, feeding the centrifugal compressor market.
LNG Liquefaction & Regas Capacity Additions
Global liquefaction capacity is on pace to grow by 300 bcm per year between 2024 and 2030, with each train relying on 4-6 centrifugal compressors to chill gas to -162 °C. Venture Global's Plaquemines project installed 72 compressors across 18 modular trains, delivering 20 mtpa of export capacity. Qatar's North Field East awarded Mitsubishi Heavy Industries a USD 1.8 billion order for 96 units that offer 8% lower power draw in part-load. On the demand side, Europe brought three FSRUs online in 2024, each using two high-pressure send-out compressors to inject gas at 70 bar. The capital-intensive, 20-year nature of LNG contracts makes these compressors long-cycle assets immune to short-term price swings.
High Capex vs. Reciprocating Alternatives
Installed costs range from USD 800 to USD 2,500 per horsepower for centrifugal machines, versus USD 600-900 for reciprocating units in mid-power ranges. Small-scale biogas and landfill-gas projects with 4,000-6,000 operating-hours per year opt for pistons because their intermittent duty does not justify centrifugal premiums. Add-on expenses such as a variable-frequency drive, anti-surge controls, and vibration monitoring add another USD 400,000-600,000. Leasing options favor reciprocating equipment in India and Southeast Asia, where financiers see lower residual-value risk. Economics swing in favor of centrifugal designs only when annual run-hours exceed 7,000 and labor costs top USD 80 per hour, thresholds still rare in many emerging regions.
Other drivers and restraints analyzed in the detailed report include:
- Industrial CCGT Capacity Expansion
- Hydrogen Hub Demand for Oil-Free Compression
- Alloy-Impeller Supply Bottlenecks
For complete list of drivers and restraints, kindly check the Table Of Contents.
Segment Analysis
Straight-through machines dominated with 88.4% centrifugal compressor market share in 2025; pipeline and gas-gathering operators value their simpler shaft line and easier bearing maintenance. Integrally geared models are forecast to expand at a 7.3% CAGR because a 30%-40% footprint reduction suits floating LNG and offshore platforms where deck space commands premiums.
The centrifugal compressor market reflects that API 617-2024 vibration limits encourage gearbox retrofits of 1990s-vintage units to avoid costly shaft modifications. European and Asian buyers facing land constraints prefer geared layouts that cut noise by 6 dB and plot area by 35%. Gearbox cost premiums are narrowing as powder-metallurgy gears extend overhaul intervals from 40,000 hours to 60,000 hours, reducing lifecycle costs by 12%.
Multi-stage equipment captured 60.6% of the centrifugal compressor market size in 2025 because long-haul pipelines and ammonia plants need 4:1 or higher pressure ratios. Yet single-stage configurations are expected to advance at a 6.8% CAGR through 2031, buoyed by data-center cooling and food processing that demand ratios below 3:1.
Computational fluid dynamics now yields 3D curved blades that push single-stage ratios to 3.8:1, eliminating intercoolers and saving USD 300,000-400,000 per train. In mining, Brazilian pellet plants selected 12 single-stage units for 20% lower maintenance due to no interstage seals. The centrifugal compressor market benefits when ISO 8573-1 Class Zero certification drives food-grade nitrogen and carbonation service away from oil-flooded pistons.
Complete Report Scope:
- By Compressor Design
- Straight-through
- Integrally geared
- By Stage
- Single-stage
- Multi-stage
- By Cooling Method
- Air-cooled
- Water-cooled
- By End-user Industry
- Oil and Gas
- Petrochemicals and Chemicals
- Power Generation
- Metals and Mining
- Food and Beverage
- Others
- By Geography
- North America
- United States
- Canada
- Mexico
- Europe
- Germany
- United Kingdom
- France
- Spain
- Italy
- NORDIC Countries
- Russia
- Rest of Europe
- Asia-Pacific
- China
- India
- Japan
- South Korea
- ASEAN Countries
- Australia and New Zealand
- Rest of Asia-Pacific
- South America
- Brazil
- Argentina
- Chile
- Rest of South America
- Middle East and Africa
- Saudi Arabia
- United Arab Emirates
- South Africa
- Egypt
- Rest of Middle East and Africa
- North America
Geography Analysis
Asia-Pacific retained 38.3% of 2025 revenue and is forecast to advance at a 6.2% CAGR as China commissioned six petrochemical complexes deploying more than 80 compressors. India's KG Basin subsea compression order for 12 units at 15 MW each highlights offshore monetization trends. Japan and South Korea are swapping out lubricant-risk units with oil-free machines to meet 10 ppm sulfur marine fuel mandates.
North America contributed close to 30% of global demand in 2025, supported by Permian pipelines and Gulf Coast liquefaction. Plaquemines LNG and Corpus Christi Stage 3 together placed 48 orders for mixed-refrigerant compressors. Canada's LNG Canada awarded a USD 1.55 billion compressor-turbine package that can handle 15% hydrogen blends. Mexico's Wahalajara system commissioned four high-pressure stations to move gas 500 km to Guadalajara.
Europe held nearly one-fifth of the centrifugal compressor market; three German FSRUs now inject regasified LNG at 70 bar. Industrial retrofits under ISO 50001 are replacing pre-2010 machines and unlocking EU Innovation Fund grants. The Middle East and Africa, roughly 13% of 2025 demand, hinge on Qatar's North Field expansion and ADNOC's Ruwais refinery upgrade, which installed 16 hydrogen recycle units. South America remains small at 4%-5% but notable for Petrobras' USD 320 million subsea compression order supporting Buzios field pressure maintenance.
- Atlas Copco AB
- Ingersoll Rand Inc.
- Siemens Energy AG
- Baker Hughes Co.
- Mitsubishi Heavy Industries Ltd
- Sundyne LLC
- Elliott Group
- Howden Group
- MAN Energy Solutions
- Kobe Steel Ltd
- HMS Group
- Borsig GmbH
- Hitachi Ltd
- Kirloskar Pneumatic Co.
- FS-Elliott
- Gardner Denver Nash
- Shenyang Blower Works Group
- Boldrocchi
- IHI Rotating Machinery
- Sulzer Ltd
Additional Benefits:
- The market estimate (ME) sheet in Excel format
- 3 months of analyst support
TABLE OF CONTENTS
1 Introduction
- 1.1 Study Assumptions & Market Definition
- 1.2 Scope of the Study
2 Research Methodology
3 Executive Summary
4 Market Landscape
- 4.1 Market Overview
- 4.2 Market Drivers
- 4.2.1 Surging natural-gas pipeline build-outs
- 4.2.2 LNG liquefaction & regas capacity additions
- 4.2.3 Industrial CCGT capacity expansion
- 4.2.4 Stricter energy-efficiency retrofits
- 4.2.5 Hydrogen hub demand for oil-free compression
- 4.2.6 Predictive-maintenance led replacement cycles
- 4.3 Market Restraints
- 4.3.1 High capex vs. reciprocating alternatives
- 4.3.2 Upstream spend cycles tied to volatile oil prices
- 4.3.3 Alloy-impeller supply bottlenecks
- 4.3.4 Rise of modular screw-compressor packages
- 4.4 Supply-Chain Analysis
- 4.5 Regulatory Landscape
- 4.6 Technological Outlook
- 4.7 Porter's Five Forces
- 4.7.1 Bargaining Power of Suppliers
- 4.7.2 Bargaining Power of Consumers
- 4.7.3 Threat of New Entrants
- 4.7.4 Threat of Substitutes
- 4.7.5 Intensity of Competitive Rivalry
5 Market Size & Growth Forecasts
- 5.1 By Compressor Design
- 5.1.1 Straight-through
- 5.1.2 Integrally geared
- 5.2 By Stage
- 5.2.1 Single-stage
- 5.2.2 Multi-stage
- 5.3 By Cooling Method
- 5.3.1 Air-cooled
- 5.3.2 Water-cooled
- 5.4 By End-user Industry
- 5.4.1 Oil and Gas
- 5.4.2 Petrochemicals and Chemicals
- 5.4.3 Power Generation
- 5.4.4 Metals and Mining
- 5.4.5 Food and Beverage
- 5.4.6 Others
- 5.5 By Geography
- 5.5.1 North America
- 5.5.1.1 United States
- 5.5.1.2 Canada
- 5.5.1.3 Mexico
- 5.5.2 Europe
- 5.5.2.1 Germany
- 5.5.2.2 United Kingdom
- 5.5.2.3 France
- 5.5.2.4 Spain
- 5.5.2.5 Italy
- 5.5.2.6 NORDIC Countries
- 5.5.2.7 Russia
- 5.5.2.8 Rest of Europe
- 5.5.3 Asia-Pacific
- 5.5.3.1 China
- 5.5.3.2 India
- 5.5.3.3 Japan
- 5.5.3.4 South Korea
- 5.5.3.5 ASEAN Countries
- 5.5.3.6 Australia and New Zealand
- 5.5.3.7 Rest of Asia-Pacific
- 5.5.4 South America
- 5.5.4.1 Brazil
- 5.5.4.2 Argentina
- 5.5.4.3 Chile
- 5.5.4.4 Rest of South America
- 5.5.5 Middle East and Africa
- 5.5.5.1 Saudi Arabia
- 5.5.5.2 United Arab Emirates
- 5.5.5.3 South Africa
- 5.5.5.4 Egypt
- 5.5.5.5 Rest of Middle East and Africa
- 5.5.1 North America
6 Competitive Landscape
- 6.1 Market Concentration
- 6.2 Strategic Moves (M&A, Partnerships, PPAs)
- 6.3 Market Share Analysis (Market Rank/Share for key companies)
- 6.4 Company Profiles (includes Global level Overview, Market level overview, Core Segments, Financials as available, Strategic Information, Products & Services, and Recent Developments)
- 6.4.1 Atlas Copco AB
- 6.4.2 Ingersoll Rand Inc.
- 6.4.3 Siemens Energy AG
- 6.4.4 Baker Hughes Co.
- 6.4.5 Mitsubishi Heavy Industries Ltd
- 6.4.6 Sundyne LLC
- 6.4.7 Elliott Group
- 6.4.8 Howden Group
- 6.4.9 MAN Energy Solutions
- 6.4.10 Kobe Steel Ltd
- 6.4.11 HMS Group
- 6.4.12 Borsig GmbH
- 6.4.13 Hitachi Ltd
- 6.4.14 Kirloskar Pneumatic Co.
- 6.4.15 FS-Elliott
- 6.4.16 Gardner Denver Nash
- 6.4.17 Shenyang Blower Works Group
- 6.4.18 Boldrocchi
- 6.4.19 IHI Rotating Machinery
- 6.4.20 Sulzer Ltd
7 Market Opportunities & Future Outlook
- 7.1 White-space & unmet-need assessment

